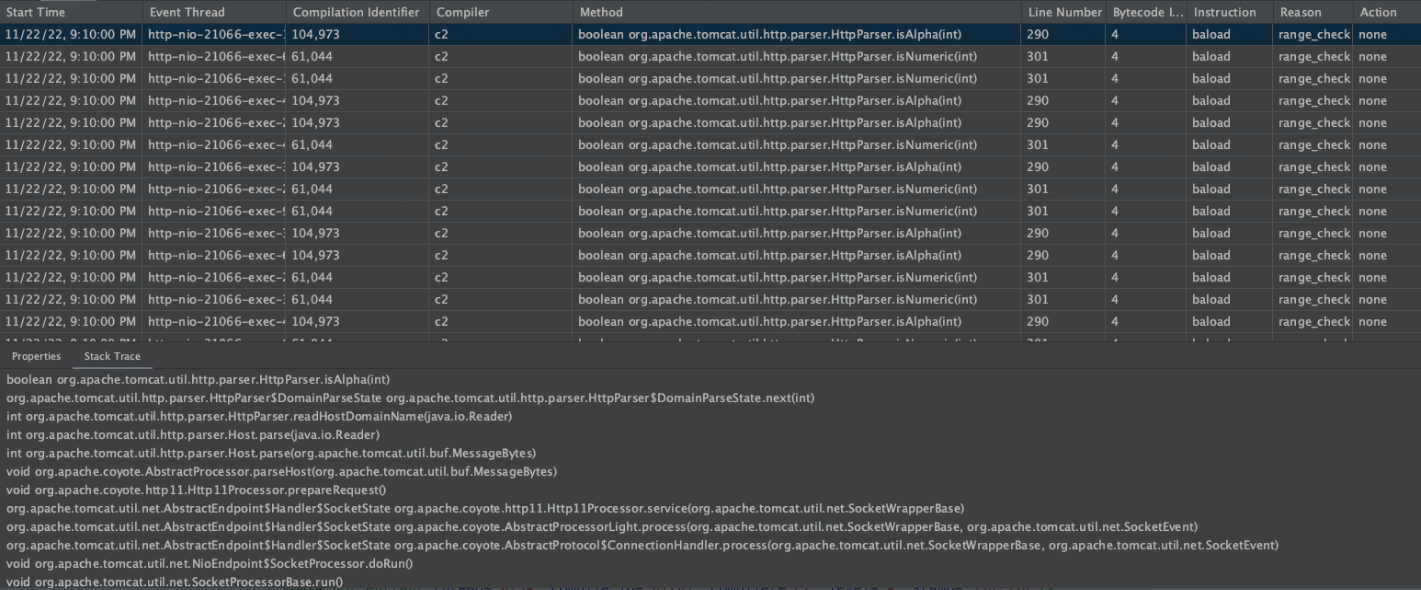
[arthas@28]$ stack org.apache.tomcat.util.http.parser.HttpParser isNumeric 'params[0] < 0' -n 5 ts=2023-01-09 13:19:10;thread_name=http-nio-22794-exec-77;id=1a93;is_daemon=true;priority=5;TCCL=java.net.URLClassLoader@7eda2dbb @org.apache.tomcat.util.http.parser.HttpParser.isNumeric() at org.apache.tomcat.util.http.parser.HttpParser$DomainParseState.next(HttpParser.java:915) at org.apache.tomcat.util.http.parser.HttpParser.readHostDomainName(HttpParser.java:842) at org.apache.tomcat.util.http.parser.Host.parse(Host.java:95) at org.apache.tomcat.util.http.parser.Host.parse(Host.java:95) at org.apache.coyote.AbstractProcessor.parseHost(AbstractProcessor.java:292) at org.apache.coyote.http11.Http11Processor.prepareRequest(Http11Processor.java:1203) at org.apache.coyote.http11.Http11Processor.service(Http11Processor.java:776) at org.apache.coyote.AbstractProcessorLight.process(AbstractProcessorLight.java:66) at org.apache.coyote.AbstractProtocol$ConnectionHandler.process(AbstractProtocol.java:806) at org.apache.tomcat.util.net.NioEndpoint$SocketProcessor.doRun(NioEndpoint.java:1498) at org.apache.tomcat.util.net.SocketProcessorBase.run(SocketProcessorBase.java:49) at java.util.concurrent.ThreadPoolExecutor.runWorker(ThreadPoolExecutor.java:1136) at java.util.concurrent.ThreadPoolExecutor$Worker.run(ThreadPoolExecutor.java:635) at org.apache.tomcat.util.threads.TaskThread$WrappingRunnable.run(TaskThread.java:61) at java.lang.Thread.run(Thread.java:833)
// 状态机实现 privatestaticenum DomainParseState { NEW(true, false, false, false, " at the start of"), ALPHA(true, true, true, true, " after a letter in"), NUMERIC(true, true, true, true, " after a number in"), PERIOD(true, false, false, true, " after a period in"), HYPHEN(true, true, false, false, " after a hypen in"), // 第一种退出场景,读取到ip:port的分割符——COLON(即":")就正常退出了 COLON(false, false, false, false, " after a colon in"), // 第二种退出场景,流结束,一直没有找到colon(比如域名的这种情况) END(false, false, false, false, " at the end of");
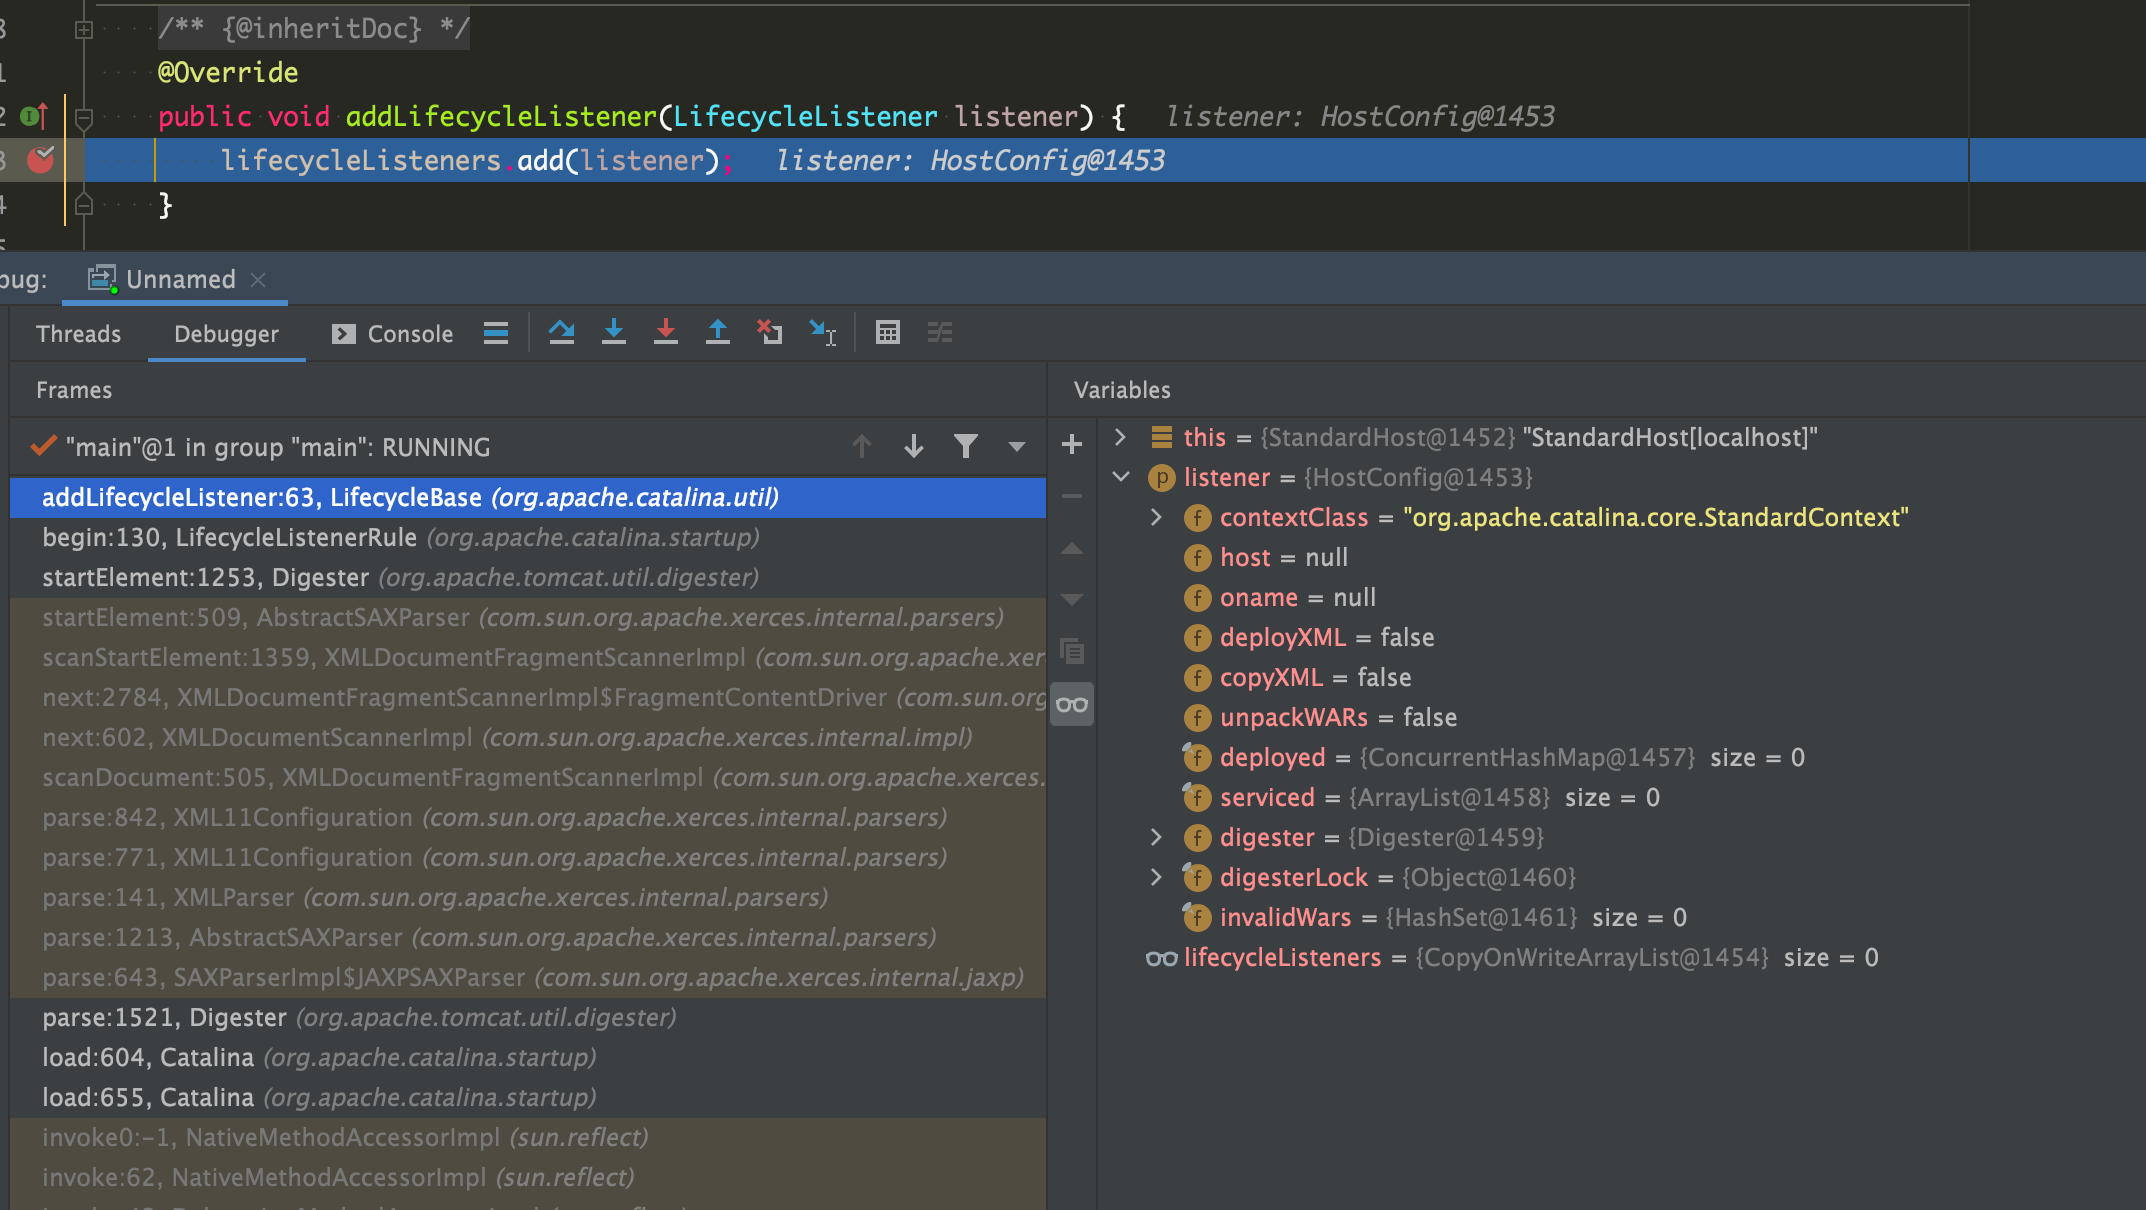
// org.apache.catalina.startup.HostConfig#lifecycleEvent /** * Process the START event for an associated Host. * * @param event The lifecycle event that has occurred */ @Override publicvoidlifecycleEvent(LifecycleEvent event){
// Identify the host we are associated with try { host = (Host) event.getLifecycle(); // 从StandardHost复制一些配置过来 if (host instanceof StandardHost) { setCopyXML(((StandardHost) host).isCopyXML()); setDeployXML(((StandardHost) host).isDeployXML()); setUnpackWARs(((StandardHost) host).isUnpackWARs()); setContextClass(((StandardHost) host).getContextClass()); } } catch (ClassCastException e) { log.error(sm.getString("hostConfig.cce", event.getLifecycle()), e); return; }
// 这里是listener提供的功能 // Process the event that has occurred if (event.getType().equals(Lifecycle.PERIODIC_EVENT)) { check(); } elseif (event.getType().equals(Lifecycle.BEFORE_START_EVENT)) { beforeStart(); } elseif (event.getType().equals(Lifecycle.START_EVENT)) { start(); } elseif (event.getType().equals(Lifecycle.STOP_EVENT)) { stop(); } }
// org.apache.catalina.core.StandardEngine#StandardEngine /** * Create a new StandardEngine component with the default basic Valve. */ publicStandardEngine(){
super(); pipeline.setBasic(new StandardEngineValve()); /* Set the jmvRoute using the system property jvmRoute */ try { setJvmRoute(System.getProperty("jvmRoute")); } catch(Exception ex) { log.warn(sm.getString("standardEngine.jvmRouteFail")); } // By default, the engine will hold the reloading thread // 这里修改了默认值 backgroundProcessorDelay = 10;
}
用jstack可以验证下,发现只有一条这个线程:
1 2 3 4 5
"ContainerBackgroundProcessor[StandardEngine[Catalina]]" #57 daemon prio=5 os_prio=31 tid=0x0000000118f72000 nid=0x7203 waiting on condition [0x000000017a0ba000] java.lang.Thread.State: TIMED_WAITING (sleeping) at java.lang.Thread.sleep(Native Method) at org.apache.catalina.core.ContainerBase$ContainerBackgroundProcessor.run(ContainerBase.java:1357) at java.lang.Thread.run(Thread.java:748)
// org.apache.catalina.core.ContainerBase#threadStart /** * Start the background thread that will periodically check for * session timeouts. */ protectedvoidthreadStart(){
if (thread != null) return; // 注意虽然Host/Context/Wrapper也继承了ContainerBase,但是这个值都是默认的-1,不会创建线程 // StandardEngine修改了默认值,所以会有这个线程,线程内会调用子容器的backgroundProcess()方法 if (backgroundProcessorDelay <= 0) return;
/** * Check status of all webapps. */ protectedvoidcheck(){
// 是否开启自动部署 if (host.getAutoDeploy()) { // Check for resources modification to trigger redeployment DeployedApplication[] apps = deployed.values().toArray(new DeployedApplication[0]); for (int i = 0; i < apps.length; i++) { if (!isServiced(apps[i].name)) checkResources(apps[i], false); }
// Check for old versions of applications that can now be undeployed if (host.getUndeployOldVersions()) { checkUndeploy(); }
// Hotdeploy applications deployApps(); } }
// org.apache.catalina.startup.HostConfig#deployApps() /** * Deploy applications for any directories or WAR files that are found * in our "application root" directory. */ protectedvoiddeployApps(){
// Start our child containers, if not already started // 子容器启动(ServletWrapper) for (Container child : findChildren()) { if (!child.getState().isAvailable()) { child.start(); } }
// Start the Valves in our pipeline (including the basic), // if any // pipeline的初始化,会拉起valve的初始化 if (pipeline instanceof Lifecycle) { ((Lifecycle) pipeline).start(); }
// Configure and call application event listeners // ServletContextListener的初始化,使用spring父子容器的话,这里会拉起父容器 // spring的listener: org.springframework.web.context.ContextLoaderListener if (ok) { if (!listenerStart()) { log.error(sm.getString("standardContext.listenerFail")); ok = false; } }
// Configure and call application filters // filter启动 if (ok) { if (!filterStart()) { log.error(sm.getString("standardContext.filterFail")); ok = false; } }
// Load and initialize all "load on startup" servlets // servlet启动,如果servlet设置了load-on-startup // 如果只是使用了spring mvc,一般就是个servlet,则是在这一步拉起来的 if (ok) { if (!loadOnStartup(findChildren())){ log.error(sm.getString("standardContext.servletFail")); ok = false; } }
Scan the web.xml files that apply to the web application and merge them using the rules defined in the spec. For the global web.xml files, where there is duplicate configuration, the most specific level wins. ie an application’s web.xml takes precedence over the host level or global web.xml file.
// org.apache.catalina.startup.ContextConfig#configureStart /** * Process a "contextConfig" event for this Context. */ protectedsynchronizedvoidconfigureStart(){ // Called from StandardContext.start()
// 处理Listener/Filter/Servlet上的@Resource注解 JSR250 if (!context.getIgnoreAnnotations()) { applicationAnnotationsConfig(); } if (ok) { validateSecurityRoles(); }
// Configure an authenticator if we need one if (ok) { authenticatorConfig(); }
// Make our application available if no problems were encountered if (ok) { context.setConfigured(true); } else { log.error(sm.getString("contextConfig.unavailable")); context.setConfigured(false); }
}
logEffectiveWebXml
Set to true if you want the effective web.xml used for a web application to be logged (at INFO level) when the application starts. The effective web.xml is the result of combining the application’s web.xml with any defaults configured by Tomcat and any web-fragment.xml files and annotations discovered. If not specified, the default value of false is used.
BEFORE_START_EVENT
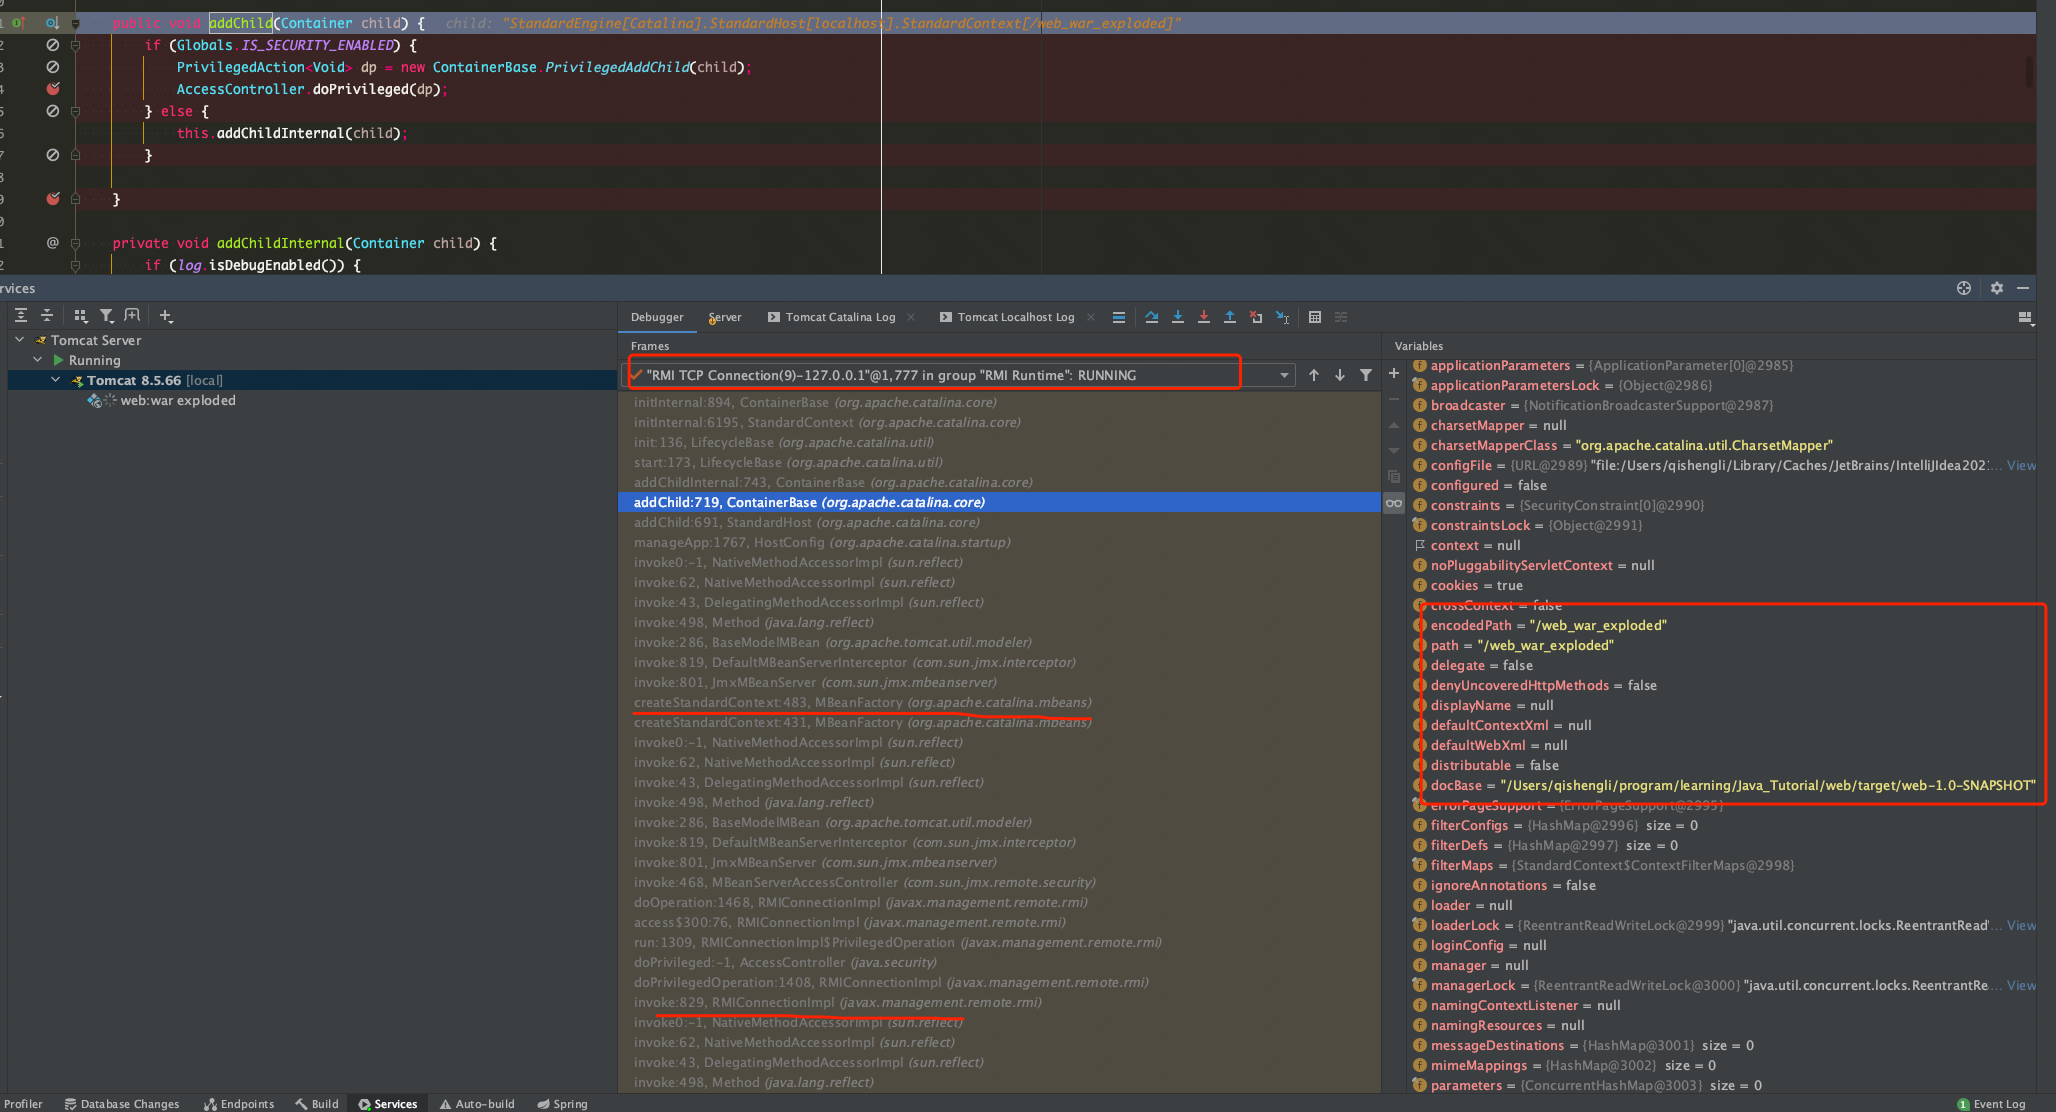
调用start之前的钩子,主要是计算docBase
1 2 3 4 5 6 7 8 9 10 11 12 13 14 15
// org.apache.catalina.startup.ContextConfig#beforeStart /** * Process a "before start" event for this Context. */ protectedsynchronizedvoidbeforeStart(){
// Restore docBase for management tools if (originalDocBase != null) { context.setDocBase(originalDocBase); }
CONFIGURE_STOP_EVENT
和configure start event对应,容器销毁时执行:
Removing children
Removing application parameters
Removing security constraints
Removing Ejbs
Removing environments
Removing errors pages
Removing filter defs
Removing filter maps
Removing local ejbs
Removing Mime mappings
Removing parameters
Removing resource env refs
Removing resource links
Removing resources
Removing security role
Removing servlet mappings
Removing welcome files
Removing wrapper lifecycles
Removing wrapper listeners
Remove (partially) folders and files created by antiLocking
Reset ServletContextInitializer scanning
AFTER_INIT_EVENT
如果存在conf/context.xml,则处理下
1 2 3 4 5 6 7 8 9 10 11 12 13 14 15 16 17 18
// org.apache.catalina.startup.ContextConfig#init /** * Process a "init" event for this Context. */ protectedvoidinit(){ // Called from StandardContext.init()
// org.apache.catalina.startup.ContextConfig#destroy /** * Process a "destroy" event for this Context. */ protectedsynchronizedvoiddestroy(){ // Called from StandardContext.destroy() if (log.isDebugEnabled()) { log.debug(sm.getString("contextConfig.destroy")); }
// Skip clearing the work directory if Tomcat is being shutdown Server s = getServer(); if (s != null && !s.getState().isAvailable()) { return; }
// Changed to getWorkPath per Bugzilla 35819. if (context instanceof StandardContext) { String workDir = ((StandardContext) context).getWorkPath(); if (workDir != null) { ExpandWar.delete(new File(workDir)); } } }
19-Oct-2022 11:32:58.320 INFO [main] org.apache.coyote.AbstractProtocol.init Initializing ProtocolHandler ["http-nio-8080"] 19-Oct-2022 11:32:58.407 INFO [main] org.apache.tomcat.util.net.NioSelectorPool.getSharedSelector Using a shared selector for servlet write/read 19-Oct-2022 11:33:07.092 INFO [main] org.apache.catalina.startup.Catalina.load Initialization processed in 9593 ms
19-Oct-2022 11:33:07.123 INFO [main] org.apache.catalina.core.StandardService.startInternal Starting service [Catalina] 19-Oct-2022 11:33:07.124 INFO [main] org.apache.catalina.core.StandardEngine.startInternal Starting Servlet engine: [Apache Tomcat/8.5.66] 19-Oct-2022 11:33:07.165 INFO [main] org.apache.coyote.AbstractProtocol.start Starting ProtocolHandler ["http-nio-8080"] 19-Oct-2022 11:33:50.942 INFO [main] org.apache.catalina.startup.Catalina.start Server startup in 43847 ms
"main@1" prio=5 tid=0x1 nid=NA runnable java.lang.Thread.State: RUNNABLE #AbstractEndpoint.init at org.apache.tomcat.util.net.AbstractEndpoint.init(AbstractEndpoint.java:1153) #AbstractJsseEndpoint.init at org.apache.tomcat.util.net.AbstractJsseEndpoint.init(AbstractJsseEndpoint.java:222) #AbstractProtocol.init at org.apache.coyote.AbstractProtocol.init(AbstractProtocol.java:599) at org.apache.coyote.http11.AbstractHttp11Protocol.init(AbstractHttp11Protocol.java:80) #Connector.initInternal at org.apache.catalina.connector.Connector.initInternal(Connector.java:1074) at org.apache.catalina.util.LifecycleBase.init(LifecycleBase.java:136) - locked <0x99f> (a org.apache.catalina.connector.Connector) #StandardService.initInternal at org.apache.catalina.core.StandardService.initInternal(StandardService.java:552) - locked <0x9c6> (a java.lang.Object) at org.apache.catalina.util.LifecycleBase.init(LifecycleBase.java:136) - locked <0x9a0> (a org.apache.catalina.core.StandardService) #StandardServer.initInternal at org.apache.catalina.core.StandardServer.initInternal(StandardServer.java:846) at org.apache.catalina.util.LifecycleBase.init(LifecycleBase.java:136) - locked <0x9a1> (a org.apache.catalina.core.StandardServer) #catalina.load at org.apache.catalina.startup.Catalina.load(Catalina.java:639) at org.apache.catalina.startup.Catalina.load(Catalina.java:662) at sun.reflect.NativeMethodAccessorImpl.invoke0(NativeMethodAccessorImpl.java:-1) at sun.reflect.NativeMethodAccessorImpl.invoke(NativeMethodAccessorImpl.java:62) at sun.reflect.DelegatingMethodAccessorImpl.invoke(DelegatingMethodAccessorImpl.java:43) at java.lang.reflect.Method.invoke(Method.java:498) at org.apache.catalina.startup.Bootstrap.load(Bootstrap.java:302) at org.apache.catalina.startup.Bootstrap.main(Bootstrap.java:472)
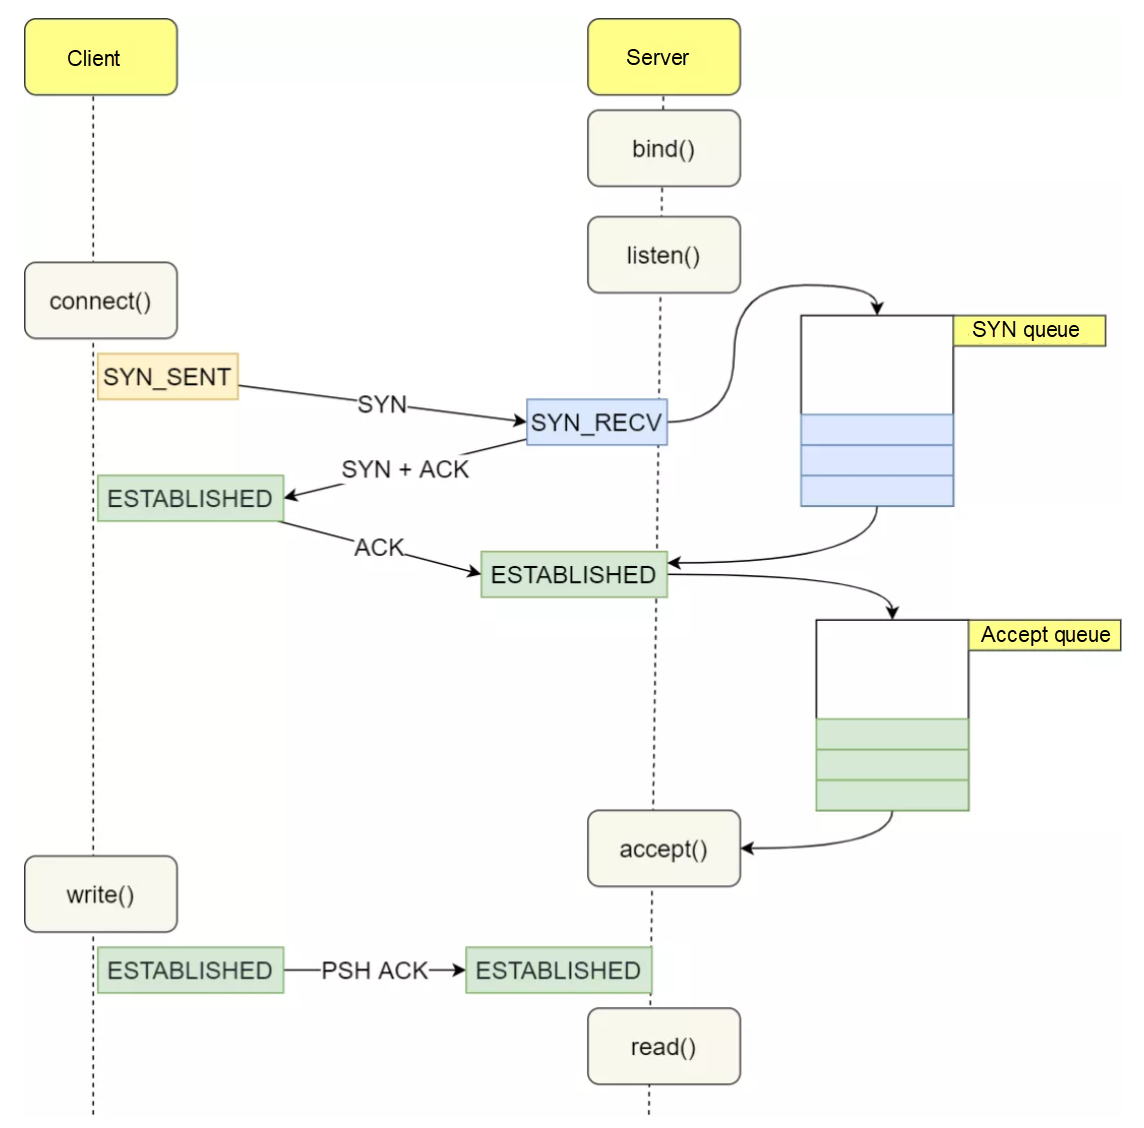
if (!getUseInheritedChannel()) { serverSock = ServerSocketChannel.open(); socketProperties.setProperties(serverSock.socket()); InetSocketAddress addr = (getAddress()!=null?new InetSocketAddress(getAddress(),getPort()):new InetSocketAddress(getPort())); // 这里进行了bind和listen serverSock.socket().bind(addr,getAcceptCount()); } else { // Retrieve the channel provided by the OS Channel ic = System.inheritedChannel(); if (ic instanceof ServerSocketChannel) { serverSock = (ServerSocketChannel) ic; } if (serverSock == null) { thrownew IllegalArgumentException(sm.getString("endpoint.init.bind.inherited")); } } serverSock.configureBlocking(true); //mimic APR behavior
// Initialize thread count defaults for acceptor, poller if (acceptorThreadCount == 0) { // FIXME: Doesn't seem to work that well with multiple accept threads acceptorThreadCount = 1; } if (pollerThreadCount <= 0) { //minimum one poller thread pollerThreadCount = 1; } setStopLatch(new CountDownLatch(pollerThreadCount));
// Initialize SSL if needed initialiseSsl();
selectorPool.open(); }
// java.net.ServerSocket#bind(java.net.SocketAddress, int) publicvoidbind(SocketAddress endpoint, int backlog)throws IOException { if (isClosed()) thrownew SocketException("Socket is closed"); if (!oldImpl && isBound()) thrownew SocketException("Already bound"); if (endpoint == null) endpoint = new InetSocketAddress(0); if (!(endpoint instanceof InetSocketAddress)) thrownew IllegalArgumentException("Unsupported address type"); InetSocketAddress epoint = (InetSocketAddress) endpoint; if (epoint.isUnresolved()) thrownew SocketException("Unresolved address"); if (backlog < 1) backlog = 50; try { SecurityManager security = System.getSecurityManager(); if (security != null) security.checkListen(epoint.getPort()); // 先bind端口 getImpl().bind(epoint.getAddress(), epoint.getPort()); // 再listen,listen时内核会创建SYN Queue和Accept Queue getImpl().listen(backlog); bound = true; } catch(SecurityException e) { bound = false; throw e; } catch(IOException e) { bound = false; throw e; } }
"main@1" prio=5 tid=0x1 nid=NA runnable java.lang.Thread.State: RUNNABLE #NioEndpoint.startInternal at org.apache.tomcat.util.net.NioEndpoint.startInternal(NioEndpoint.java:261) #AbstractEndpoint.start at org.apache.tomcat.util.net.AbstractEndpoint.start(AbstractEndpoint.java:1219) #AbstractProtocol.start at org.apache.coyote.AbstractProtocol.start(AbstractProtocol.java:609) #Connector.startInternal at org.apache.catalina.connector.Connector.startInternal(Connector.java:1099) at org.apache.catalina.util.LifecycleBase.start(LifecycleBase.java:183) - locked <0x99d> (a org.apache.catalina.connector.Connector) #StandardService.startInternal at org.apache.catalina.core.StandardService.startInternal(StandardService.java:440) - locked <0xa6a> (a java.lang.Object) at org.apache.catalina.util.LifecycleBase.start(LifecycleBase.java:183) - locked <0x99e> (a org.apache.catalina.core.StandardService) #StandardServer.startInternal at org.apache.catalina.core.StandardServer.startInternal(StandardServer.java:766) - locked <0xa6b> (a java.lang.Object) at org.apache.catalina.util.LifecycleBase.start(LifecycleBase.java:183) - locked <0x99f> (a org.apache.catalina.core.StandardServer) #Catalina.start at org.apache.catalina.startup.Catalina.start(Catalina.java:688) at sun.reflect.NativeMethodAccessorImpl.invoke0(NativeMethodAccessorImpl.java:-1) at sun.reflect.NativeMethodAccessorImpl.invoke(NativeMethodAccessorImpl.java:62) at sun.reflect.DelegatingMethodAccessorImpl.invoke(DelegatingMethodAccessorImpl.java:43) at java.lang.reflect.Method.invoke(Method.java:498) at org.apache.catalina.startup.Bootstrap.start(Bootstrap.java:342) at org.apache.catalina.startup.Bootstrap.main(Bootstrap.java:473)
processorCache = new SynchronizedStack<>(SynchronizedStack.DEFAULT_SIZE, socketProperties.getProcessorCache()); eventCache = new SynchronizedStack<>(SynchronizedStack.DEFAULT_SIZE, socketProperties.getEventCache()); nioChannels = new SynchronizedStack<>(SynchronizedStack.DEFAULT_SIZE, socketProperties.getBufferPool());
// org.apache.tomcat.util.net.NioEndpoint.Acceptor /** * The background thread that listens for incoming TCP/IP connections and * hands them off to an appropriate processor. */ protectedclassAcceptorextendsAbstractEndpoint.Acceptor{
@Override publicvoidrun(){
int errorDelay = 0;
// Loop until we receive a shutdown command while (running) {
// Loop if endpoint is paused while (paused && running) { state = AcceptorState.PAUSED; try { Thread.sleep(50); } catch (InterruptedException e) { // Ignore } }
if (!running) { break; } state = AcceptorState.RUNNING;
try { //if we have reached max connections, wait countUpOrAwaitConnection();
SocketChannel socket = null; try { // Accept the next incoming connection from the server // socket // 注意这里accept了 socket = serverSock.accept(); } catch (IOException ioe) { // We didn't get a socket countDownConnection(); if (running) { // Introduce delay if necessary errorDelay = handleExceptionWithDelay(errorDelay); // re-throw throw ioe; } else { break; } } // Successful accept, reset the error delay errorDelay = 0;
// Configure the socket if (running && !paused) { // setSocketOptions() will hand the socket off to // an appropriate processor if successful if (!setSocketOptions(socket)) { closeSocket(socket); } } else { closeSocket(socket); } } catch (Throwable t) { ExceptionUtils.handleThrowable(t); log.error(sm.getString("endpoint.accept.fail"), t); } } state = AcceptorState.ENDED; }
19-Oct-2022 14:51:28.147 INFO [main] org.apache.coyote.AbstractProtocol.init Initializing ProtocolHandler ["http-nio-8080"] 19-Oct-2022 14:51:28.164 INFO [main] org.apache.tomcat.util.net.NioSelectorPool.getSharedSelector Using a shared selector for servlet write/read 19-Oct-2022 14:51:28.176 INFO [main] org.apache.catalina.startup.Catalina.load Initialization processed in 501 ms 19-Oct-2022 14:51:28.237 INFO [main] org.apache.catalina.core.StandardService.startInternal Starting service [Catalina] 19-Oct-2022 14:51:28.237 INFO [main] org.apache.catalina.core.StandardEngine.startInternal Starting Servlet engine: [Apache Tomcat/8.5.66] 19-Oct-2022 14:51:28.251 INFO [main] org.apache.coyote.AbstractProtocol.start Starting ProtocolHandler ["http-nio-8080"] 19-Oct-2022 14:51:28.257 INFO [main] org.apache.catalina.startup.Catalina.start Server startup in 80 ms Connected to server [2022-10-19 02:51:28,339] Artifact web:war exploded: Artifact is being deployed, please wait... 19-Oct-2022 14:51:28.747 INFO [RMI TCP Connection(2)-127.0.0.1] org.apache.jasper.servlet.TldScanner.scanJars At least one JAR was scanned for TLDs yet contained no TLDs. Enable debug logging for this logger for a complete list of JARs that were scanned but no TLDs were found in them. Skipping unneeded JARs during scanning can improve startup time and JSP compilation time. 14:51:28.803 [RMI TCP Connection(2)-127.0.0.1] INFO c.a.context.SimpleLogContextListener - contextInitialized... begin sleep 19-Oct-2022 14:51:38.253 INFO [localhost-startStop-1] org.apache.catalina.startup.HostConfig.deployDirectory Deploying web application directory [/Users/qishengli/Downloads/apache-tomcat-8.5.66/webapps/manager] 19-Oct-2022 14:51:38.278 INFO [localhost-startStop-1] org.apache.jasper.servlet.TldScanner.scanJars At least one JAR was scanned for TLDs yet contained no TLDs. Enable debug logging for this logger for a complete list of JARs that were scanned but no TLDs were found in them. Skipping unneeded JARs during scanning can improve startup time and JSP compilation time. 19-Oct-2022 14:51:38.296 INFO [localhost-startStop-1] org.apache.catalina.startup.HostConfig.deployDirectory Deployment of web application directory [/Users/qishengli/Downloads/apache-tomcat-8.5.66/webapps/manager] has finished in [42] ms 14:51:38.812 [RMI TCP Connection(2)-127.0.0.1] INFO com.air.filter.TestFilter - initing Filter... 14:51:48.818 [RMI TCP Connection(2)-127.0.0.1] INFO com.air.TestServlet2 - init TestServlet2... 14:51:58.819 [RMI TCP Connection(2)-127.0.0.1] INFO com.air.SampleServlet - initing sample servlet 14:51:58.820 [RMI TCP Connection(2)-127.0.0.1] INFO com.air.TestServlet3 - init TestServlet3... [2022-10-19 02:52:08,833] Artifact web:war exploded: Artifact is deployed successfully [2022-10-19 02:52:08,833] Artifact web:war exploded: Deploy took 40,494 milliseconds
19-Oct-2022 14:29:36.778 INFO [main] org.apache.coyote.AbstractProtocol.init Initializing ProtocolHandler ["http-nio-21002"] 19-Oct-2022 14:29:36.790 INFO [main] org.apache.tomcat.util.net.NioSelectorPool.getSharedSelector Using a shared selector for servlet write/read 19-Oct-2022 14:29:36.796 INFO [main] org.apache.catalina.startup.Catalina.load Initialization processed in 448 ms 19-Oct-2022 14:29:36.801 INFO [main] org.apache.catalina.core.StandardService.startInternal Starting service [Catalina] 19-Oct-2022 14:29:36.801 INFO [main] org.apache.catalina.core.StandardEngine.startInternal Starting Servlet Engine: Apache Tomcat/8.5.38 19-Oct-2022 14:29:38.641 INFO [localhost-startStop-1] org.apache.jasper.servlet.TldScanner.scanJars At least one JAR was scanned for TLDs yet contained no TLDs. Enable debug logging for this logger for a complete list of JARs that were scanned but no TLDs were found in them. Skipping unneeded JARs during scanning can improve startup time and JSP compilation time. # 中间有业务日志 19-Oct-2022 14:34:25.888 INFO [main] org.apache.coyote.AbstractProtocol.start Starting ProtocolHandler ["http-nio-21002"] 19-Oct-2022 14:34:25.894 INFO [main] org.apache.catalina.startup.Catalina.start Server startup in 289097 ms
19-Oct-2022 14:51:38.296 INFO [localhost-startStop-1] org.apache.catalina.startup.HostConfig.deployDirectory Deployment of web application directory [/Users/qishengli/Downloads/apache-tomcat-8.5.66/webapps/manager] has finished in [42] ms
The number of milliseconds this Connector will wait, after accepting a connection, for the request URI line to be presented. Use a value of -1 to indicate no (i.e. infinite) timeout. The default value is 60000 (i.e. 60 seconds) but note that the standard server.xml that ships with Tomcat sets this to 20000 (i.e. 20 seconds). Unless disableUploadTimeout is set to false, this timeout will also be used when reading the request body (if any).
➜ qsli.github.com (hexo|✚23…) time telnet localhost 8087 Trying ::1... Connected to localhost. Escape character is '^]'. Connection closed by foreign host. telnet localhost 8087 0.01s user 0.01s system 0% cpu 20.064 total
// org.apache.coyote.AbstractProtocol#getConnectionTimeout /* * When Tomcat expects data from the client, this is the time Tomcat will * wait for that data to arrive before closing the connection. */ publicintgetConnectionTimeout(){ // Note that the endpoint uses the alternative name return endpoint.getSoTimeout(); } publicvoidsetConnectionTimeout(int timeout){ // Note that the endpoint uses the alternative name endpoint.setSoTimeout(timeout); }
//org.apache.tomcat.util.net.NioEndpoint.Poller#register /** * Registers a newly created socket with the poller. * * @param socket The newly created socket */ publicvoidregister(final NioChannel socket){ socket.setPoller(this); NioSocketWrapper ka = new NioSocketWrapper(socket, NioEndpoint.this); socket.setSocketWrapper(ka); ka.setPoller(this); // 这里,read/write timeout ka.setReadTimeout(getSocketProperties().getSoTimeout()); ka.setWriteTimeout(getSocketProperties().getSoTimeout()); ka.setKeepAliveLeft(NioEndpoint.this.getMaxKeepAliveRequests()); ka.setSecure(isSSLEnabled()); ka.setReadTimeout(getSoTimeout()); ka.setWriteTimeout(getSoTimeout()); PollerEvent r = eventCache.pop(); ka.interestOps(SelectionKey.OP_READ);//this is what OP_REGISTER turns into. if ( r==null) r = new PollerEvent(socket,ka,OP_REGISTER); else r.reset(socket,ka,OP_REGISTER); addEvent(r); }
Poller线程中会check这个key是否过期,并不是每次都check,而是有一定的策略:
However, do process timeouts if any of the following are true:
the selector simply timed out (suggests there isn’t much load)
// org.apache.tomcat.util.net.NioEndpoint.Poller#timeout protectedvoidtimeout(int keyCount, boolean hasEvents){ long now = System.currentTimeMillis(); // This method is called on every loop of the Poller. Don't process // timeouts on every loop of the Poller since that would create too // much load and timeouts can afford to wait a few seconds. // However, do process timeouts if any of the following are true: // - the selector simply timed out (suggests there isn't much load) // - the nextExpiration time has passed // - the server socket is being closed if (nextExpiration > 0 && (keyCount > 0 || hasEvents) && (now < nextExpiration) && !close) { return; } //timeout int keycount = 0; try { for (SelectionKey key : selector.keys()) { keycount++; try { NioSocketWrapper ka = (NioSocketWrapper) key.attachment(); if ( ka == null ) { cancelledKey(key); //we don't support any keys without attachments } elseif (close) { key.interestOps(0); ka.interestOps(0); //avoid duplicate stop calls processKey(key,ka); } elseif ((ka.interestOps()&SelectionKey.OP_READ) == SelectionKey.OP_READ || (ka.interestOps()&SelectionKey.OP_WRITE) == SelectionKey.OP_WRITE) { boolean isTimedOut = false; // Check for read timeout // 读超时 if ((ka.interestOps() & SelectionKey.OP_READ) == SelectionKey.OP_READ) { long delta = now - ka.getLastRead(); long timeout = ka.getReadTimeout(); isTimedOut = timeout > 0 && delta > timeout; } // Check for write timeout // 写超时 if (!isTimedOut && (ka.interestOps() & SelectionKey.OP_WRITE) == SelectionKey.OP_WRITE) { long delta = now - ka.getLastWrite(); long timeout = ka.getWriteTimeout(); isTimedOut = timeout > 0 && delta > timeout; } // 超时之后处理 if (isTimedOut) { key.interestOps(0); ka.interestOps(0); //avoid duplicate timeout calls ka.setError(new SocketTimeoutException()); // 注意这里是SocketEvent.ERROR if (!processSocket(ka, SocketEvent.ERROR, true)) { cancelledKey(key); } } } }catch ( CancelledKeyException ckx ) { cancelledKey(key); } }//for } catch (ConcurrentModificationException cme) { // See https://bz.apache.org/bugzilla/show_bug.cgi?id=57943 log.warn(sm.getString("endpoint.nio.timeoutCme"), cme); } long prevExp = nextExpiration; //for logging purposes only nextExpiration = System.currentTimeMillis() + socketProperties.getTimeoutInterval(); if (log.isTraceEnabled()) { log.trace("timeout completed: keys processed=" + keycount + "; now=" + now + "; nextExpiration=" + prevExp + "; keyCount=" + keyCount + "; hasEvents=" + hasEvents + "; eval=" + ((now < prevExp) && (keyCount>0 || hasEvents) && (!close) )); } }
// org.apache.coyote.AbstractProtocol.ConnectionHandler#process @Override public SocketState process(SocketWrapperBase<S> wrapper, SocketEvent status){ if (getLog().isDebugEnabled()) { getLog().debug(sm.getString("abstractConnectionHandler.process", wrapper.getSocket(), status)); } if (wrapper == null) { // Nothing to do. Socket has been closed. return SocketState.CLOSED; }
S socket = wrapper.getSocket();
Processor processor = connections.get(socket); if (processor != null) { // Make sure an async timeout doesn't fire getProtocol().removeWaitingProcessor(processor); } elseif (status == SocketEvent.DISCONNECT || status == SocketEvent.ERROR) { // Nothing to do. Endpoint requested a close and there is no // longer a processor associated with this socket. // 走到这里了,最终决定将连接关闭 return SocketState.CLOSED; }
]]>
<blockquote>
<p>The number of milliseconds this <strong>Connector</strong> will wait, after accepting a connection, for the request URI line
tomcat的线程池为什么不回落?http://qsli.github.io/2022/10/06/tomcat-threadpool-timeout/2022-10-05T16:25:21.000Z2022-10-05T16:25:21.742Z现象
@param keepAliveTime when the number of threads is greater than the core, this is the maximum time that excess idle threads will wait for new tasks before terminating.
// java.util.concurrent.locks.ReentrantLock.Sync#nonfairTryAcquire /** * Performs non-fair tryLock. tryAcquire is implemented in * subclasses, but both need nonfair try for trylock method. */ @ReservedStackAccess finalbooleannonfairTryAcquire(int acquires){ final Thread current = Thread.currentThread(); int c = getState(); if (c == 0) { // 因为是非公平,这里直接抢一次 if (compareAndSetState(0, acquires)) { setExclusiveOwnerThread(current); returntrue; } } // 如果没有抢到,看看是不是自己已经获取(可重入) elseif (current == getExclusiveOwnerThread()) { int nextc = c + acquires; if (nextc < 0) // overflow thrownew Error("Maximum lock count exceeded"); setState(nextc); returntrue; } // 最终抢失败,返回false returnfalse; }
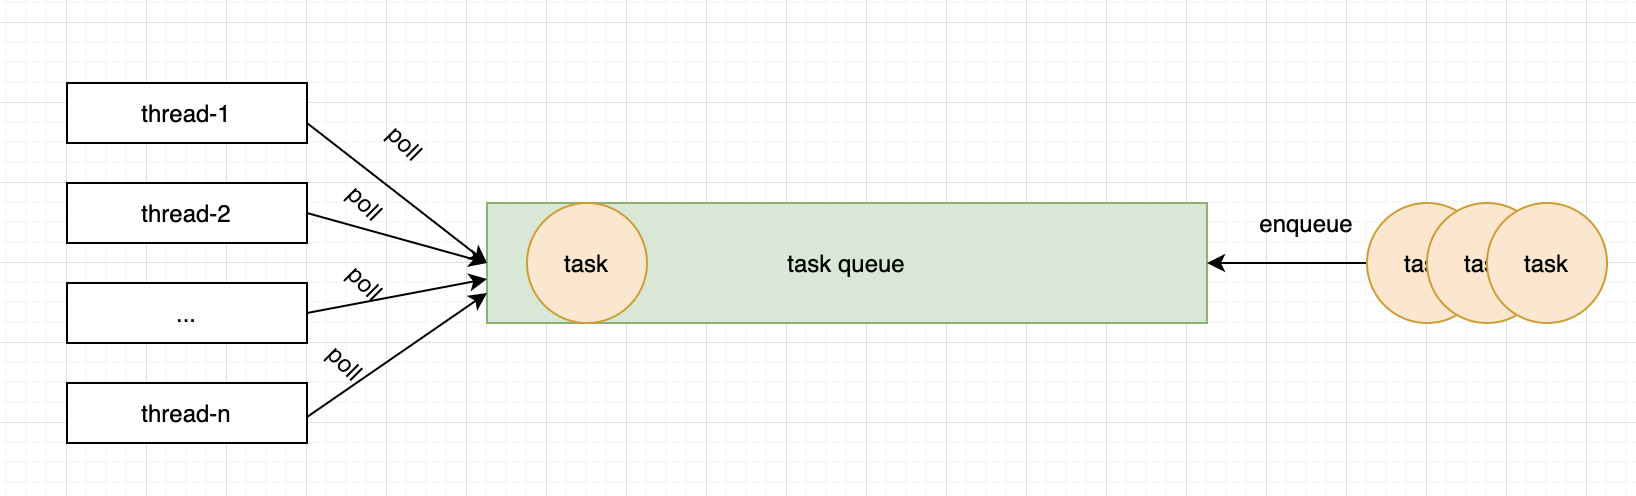
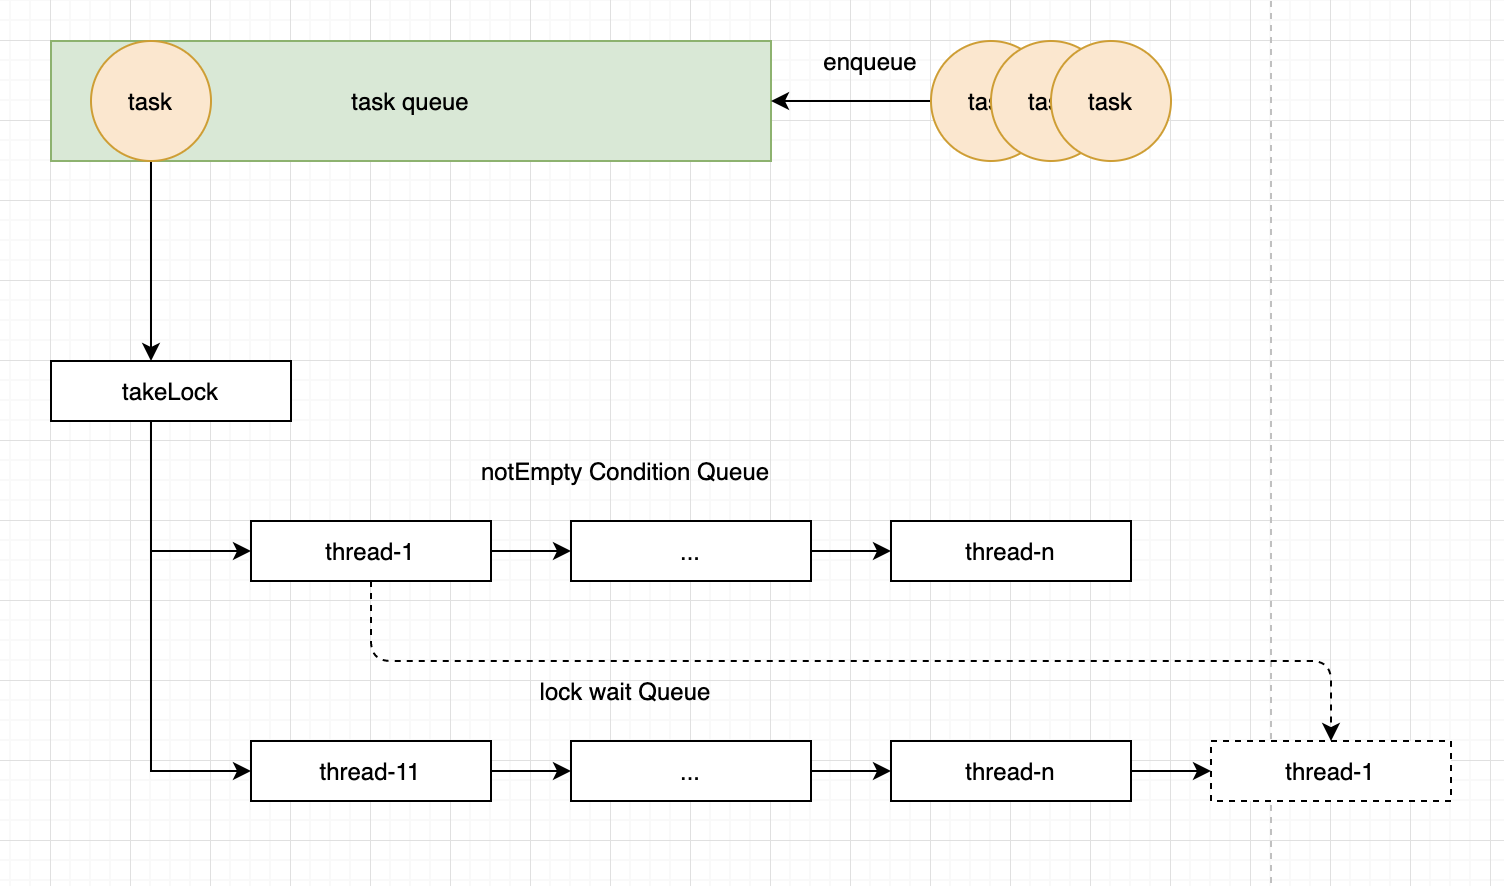
qps比较低的场景下,锁的竞争并不激烈,大部分线程即使抢到了锁,也拿不到任务,只能在条件队列中。
1
2
3
4
5
6
7
8
9
10
11
12
13
14
15
16
// java.util.concurrent.locks.AbstractQueuedLongSynchronizer.ConditionObject#signal /** * Moves the longest-waiting thread, if one exists, from the * wait queue for this condition to the wait queue for the * owning lock. * * @throws IllegalMonitorStateException if {@link #isHeldExclusively} * returns {@code false} */ publicfinalvoidsignal(){ if (!isHeldExclusively()) thrownew IllegalMonitorStateException(); Node first = firstWaiter; if (first != null) doSignal(first); }
<!--The connectors can use a shared executor, you can define one or more named thread pools--> <Executorname="tomcatThreadPool"namePrefix="catalina-exec-" maxThreads="10"minSpareThreads="3"maxIdleTime="10000"/> <Connectorexecutor="tomcatThreadPool" port="8080"protocol="HTTP/1.1" connectionTimeout="20000" redirectPort="8443" />
<Executorname="tomcatThreadPool"namePrefix="catalina-exec-" maxThreads="7"minSpareThreads="4"maxQueueSize="3"/> <!-- A "Connector" using the shared thread pool--> <Connectorexecutor="tomcatThreadPool" port="8080"protocol="HTTP/1.1" connectionTimeout="20000" redirectPort="8443" />
java.util.concurrent.RejectedExecutionException: The executor's work queue is full at org.apache.catalina.core.StandardThreadExecutor.execute(StandardThreadExecutor.java:179) at org.apache.tomcat.util.net.AbstractEndpoint.processSocket(AbstractEndpoint.java:1105) at org.apache.tomcat.util.net.NioEndpoint$Poller.processKey(NioEndpoint.java:896) at org.apache.tomcat.util.net.NioEndpoint$Poller.run(NioEndpoint.java:872) at java.lang.Thread.run(Thread.java:750)
Executes the given command at some time in the future. The command may execute in a new thread, in a pooled thread, or in the calling thread, at the discretion of the Executor implementation. If no threads are available, it will be added to the work queue. If the work queue is full, the system will wait for the specified time and it throw a RejectedExecutionException if the queue is stillfull after that.
// org.apache.tomcat.util.threads.ThreadPoolExecutor#execute(java.lang.Runnable, long, java.util.concurrent.TimeUnit) // @deprecated This will be removed in Tomcat 10.1.x onwards @Deprecated publicvoidexecute(Runnable command, long timeout, TimeUnit unit){ submittedCount.incrementAndGet(); try { executeInternal(command); } catch (RejectedExecutionException rx) { if (getQueue() instanceof TaskQueue) { // If the Executor is close to maximum pool size, concurrent // calls to execute() may result (due to Tomcat's use of // TaskQueue) in some tasks being rejected rather than queued. // If this happens, add them to the queue. final TaskQueue queue = (TaskQueue) getQueue(); try { // 如果是TaskQueue,这里还会等一会儿,如果还是失败,再抛出异常 if (!queue.force(command, timeout, unit)) { submittedCount.decrementAndGet(); thrownew RejectedExecutionException(sm.getString("threadPoolExecutor.queueFull")); } } catch (InterruptedException x) { submittedCount.decrementAndGet(); thrownew RejectedExecutionException(x); } } else { submittedCount.decrementAndGet(); throw rx; } } }
// org.apache.catalina.core.StandardThreadExecutor#execute(java.lang.Runnable) @Override publicvoidexecute(Runnable command){ if (executor != null) { // Note any RejectedExecutionException due to the use of TaskQueue // will be handled by the o.a.t.u.threads.ThreadPoolExecutor // 没地方传超时 executor.execute(command); } else { thrownew IllegalStateException(sm.getString("standardThreadExecutor.notStarted")); } }
// org.apache.tomcat.util.net.AbstractEndpoint#processSocket publicbooleanprocessSocket(SocketWrapperBase<S> socketWrapper, SocketEvent event, boolean dispatch){ try { // 省略 SocketProcessorBase<S> sc = processorCache.pop(); Executor executor = getExecutor(); if (dispatch && executor != null) { executor.execute(sc); } else { sc.run(); } } catch (RejectedExecutionException ree) { getLog().warn(sm.getString("endpoint.executor.fail", socketWrapper) , ree); returnfalse; } catch (Throwable t) { ExceptionUtils.handleThrowable(t); // This means we got an OOM or similar creating a thread, or that // the pool and its queue are full getLog().error(sm.getString("endpoint.process.fail"), t); returnfalse; } returntrue; }
// org.apache.tomcat.util.net.NioEndpoint.Poller#processKey if (!processSocket(attachment, SocketEvent.OPEN_READ, true)) { closeSocket = true; } if (closeSocket) { cancelledKey(sk); }
// org.apache.tomcat.util.net.NioEndpoint.Poller#cancelledKey // If attachment is non-null then there may be a current // connection with an associated processor. 1. getHandler().release(ka); 2. key.cancel(); 3. ka.getSocket().close(true); 4. countDownConnection();
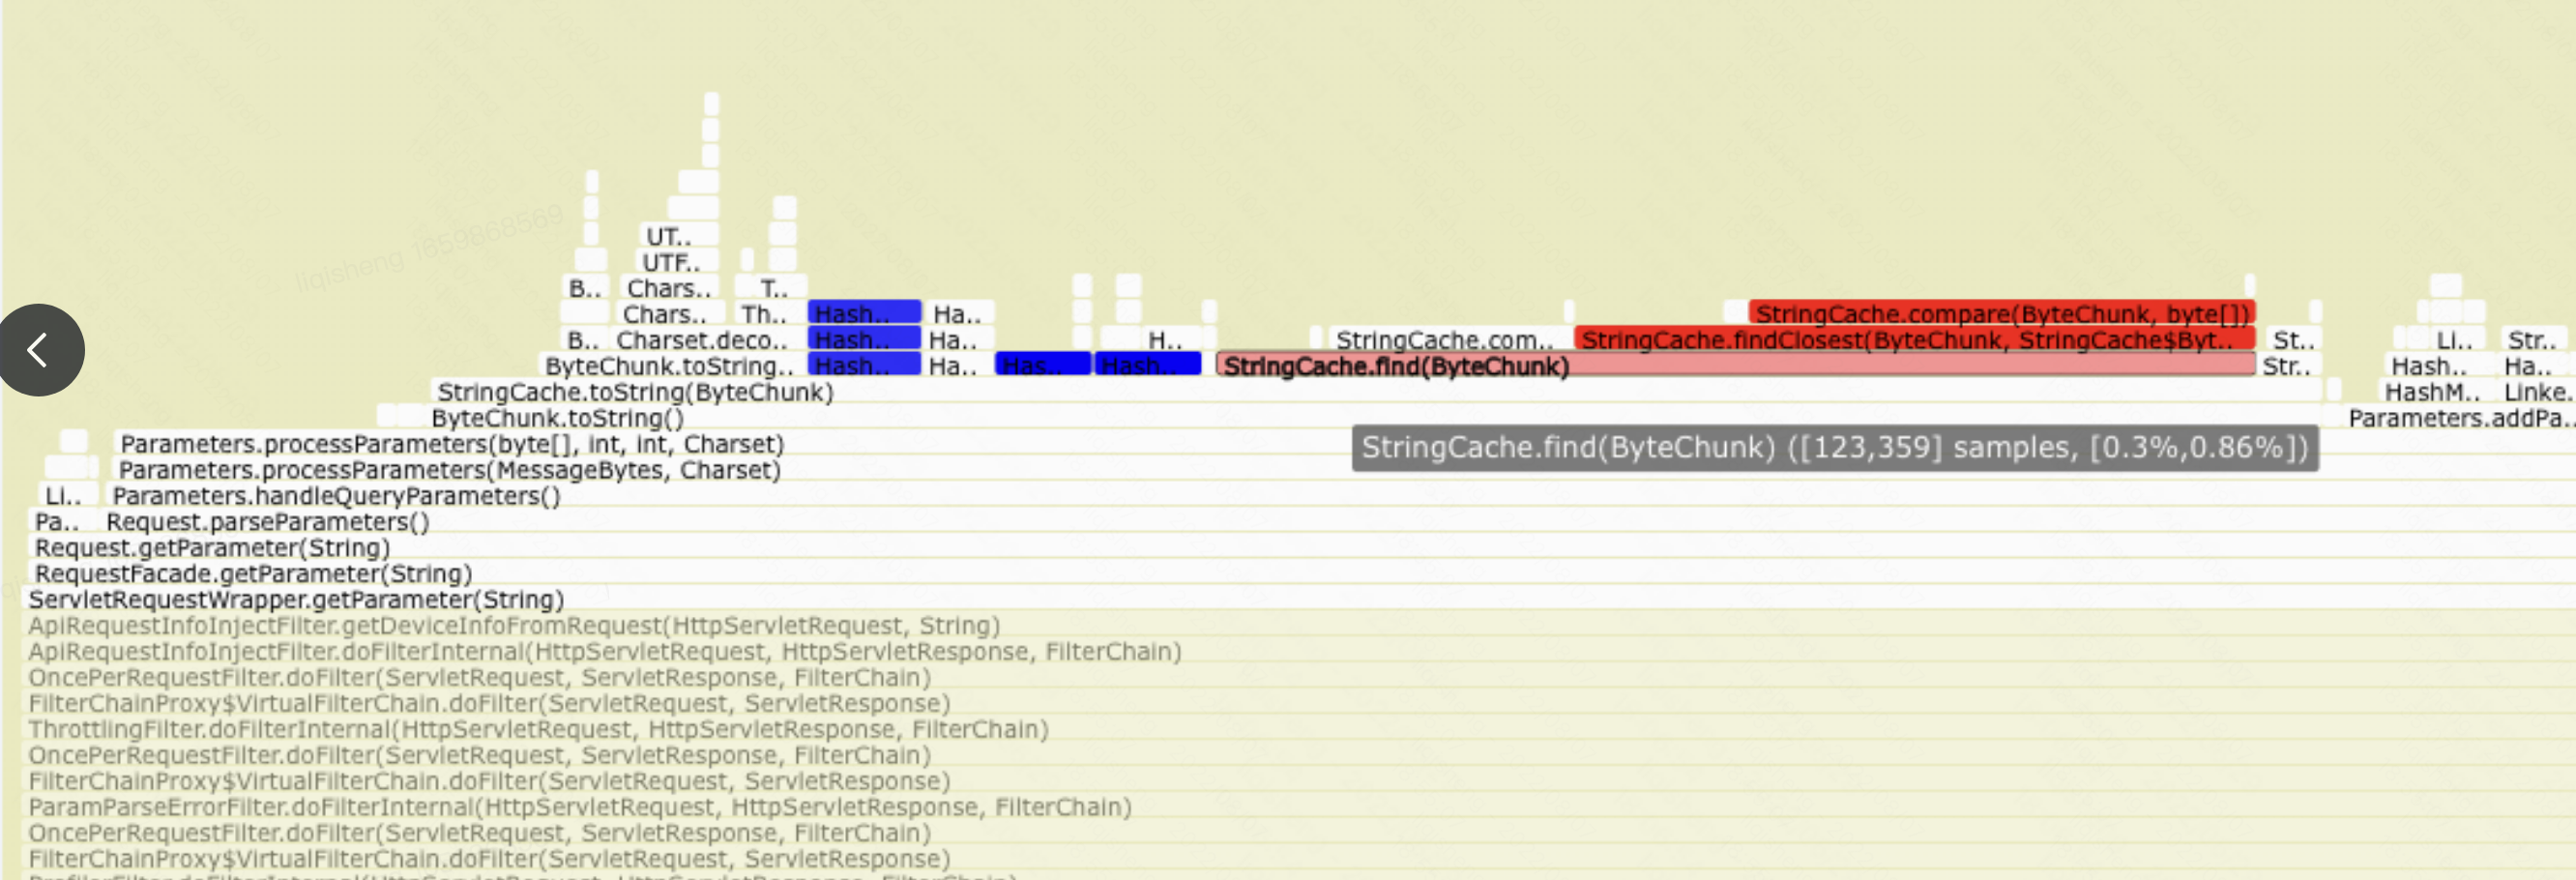
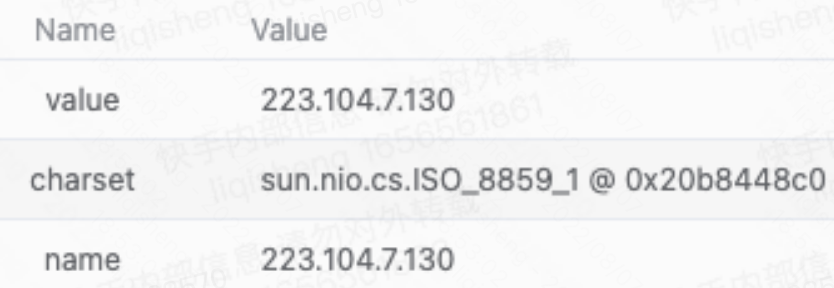
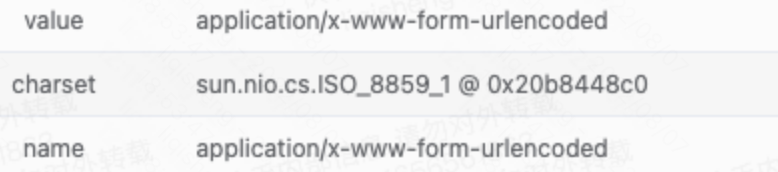
//org.apache.tomcat.util.buf.StringCache#findClosest(org.apache.tomcat.util.buf.ByteChunk, org.apache.tomcat.util.buf.StringCache.ByteEntry[], int) /** * Find an entry given its name in a sorted array of map elements. * This will return the index for the closest inferior or equal item in the * given array. * @param name The name to find * @param array The array in which to look * @param len The effective length of the array * @return the position of the best match */ protectedstaticfinalintfindClosest(ByteChunk name, ByteEntry[] array, int len){
// 二分查找的low和high int a = 0; int b = len - 1;
// Special cases: -1 and 0 if (b == -1) { return -1; }
if (compare(name, array[0].name) < 0) { return -1; } if (b == 0) { return0; } // 以上是特殊的case int i = 0; while (true) { // 取中间坐标,用位运算避免溢出风险 i = (b + a) >>> 1; // compare的结果, -1, 0, 1 int result = compare(name, array[i].name); // 在右侧,更新low if (result == 1) { a = i; } elseif (result == 0) { // 正好查找到 return i; } else { // 在左侧,缩减high b = i; } // 特殊情况 if ((b - a) == 1) { int result2 = compare(name, array[b].name); if (result2 < 0) { return a; } else { return b; } } }
// org.apache.tomcat.util.buf.StringCache#toString(org.apache.tomcat.util.buf.ByteChunk) // If the cache is null, then either caching is disabled, or we're // still training if (bcCache == null) { // bcCache为空,1.在training阶段,2. cache被禁用了 // 所以这里直接调用了对应的toString方法 String value = bc.toStringInternal(); // 缓存开关打开了,开始构建缓存的统计信息 // 这里有个String上线的限制,有相应的bug:https://bz.apache.org/bugzilla/show_bug.cgi?id=41057 if (byteEnabled && (value.length() < maxStringSize)) { // If training, everything is synced synchronized (bcStats) { // If the cache has been generated on a previous invocation // while waiting for the lock, just return the toString // value we just calculated // double checked lock, 在同步代码块中再次check if (bcCache != null) { return value; } // Two cases: either we just exceeded the train count, in // which case the cache must be created, or we just update // the count for the string // 超过训练阈值,构建cache逻辑 if (bcCount > trainThreshold) { long t1 = System.currentTimeMillis(); // Sort the entries according to occurrence // stats中每个item的出现次数 TreeMap<Integer,ArrayList<ByteEntry>> tempMap = new TreeMap<>(); for (Entry<ByteEntry,int[]> item : bcStats.entrySet()) { ByteEntry entry = item.getKey(); int[] countA = item.getValue(); Integer count = Integer.valueOf(countA[0]); // Add to the list for that count ArrayList<ByteEntry> list = tempMap.get(count); if (list == null) { // Create list list = new ArrayList<>(); tempMap.put(count, list); } list.add(entry); } // Allocate array of the right size // 不能超过缓存的上限 int size = bcStats.size(); if (size > cacheSize) { size = cacheSize; } ByteEntry[] tempbcCache = new ByteEntry[size]; // Fill it up using an alphabetical order // and a dumb insert sort ByteChunk tempChunk = new ByteChunk(); int n = 0; while (n < size) { // TreeMap,这里取lastKey就是出现次数最多的 Object key = tempMap.lastKey(); ArrayList<ByteEntry> list = tempMap.get(key); // 出现次数并列的情况 for (int i = 0; i < list.size() && n < size; i++) { ByteEntry entry = list.get(i); tempChunk.setBytes(entry.name, 0, entry.name.length); // 二分查找,找到插入位置 int insertPos = findClosest(tempChunk, tempbcCache, n); if (insertPos == n) { tempbcCache[n + 1] = entry; } else { System.arraycopy(tempbcCache, insertPos + 1, tempbcCache, insertPos + 2, n - insertPos - 1); tempbcCache[insertPos + 1] = entry; } n++; } // 删除掉已经处理的 tempMap.remove(key); } // while loop bcCount = 0; // 构建完成,清理掉stat数据 bcStats.clear(); bcCache = tempbcCache; if (log.isDebugEnabled()) { long t2 = System.currentTimeMillis(); log.debug("ByteCache generation time: " + (t2 - t1) + "ms"); } } else { // ----------------- 以下是收集训练数据的过程 ----------------- bcCount++; // Allocate new ByteEntry for the lookup ByteEntry entry = new ByteEntry(); entry.value = value; int[] count = bcStats.get(entry); if (count == null) { int end = bc.getEnd(); int start = bc.getStart(); // Create byte array and copy bytes entry.name = newbyte[bc.getLength()]; System.arraycopy(bc.getBuffer(), start, entry.name, 0, end - start); // Set encoding entry.charset = bc.getCharset(); // Initialize occurrence count to one count = newint[1]; count[0] = 1; // Set in the stats hash map bcStats.put(entry, count); } else { // 更新出现的次数 count[0] = count[0] + 1; } } } } return value; } else { // 走缓存的逻辑,这里忽略 }
[Loaded sun.reflect.NativeMethodAccessorImpl from /Library/Java/JavaVirtualMachines/zulu-8.jdk/Contents/Home/jre/lib/rt.jar] [Loaded sun.reflect.DelegatingMethodAccessorImpl from /Library/Java/JavaVirtualMachines/zulu-8.jdk/Contents/Home/jre/lib/rt.jar] java.lang.RuntimeException at com.air.lang.reflect.ReflectTest.getCount(ReflectTest.java:21) at sun.reflect.NativeMethodAccessorImpl.invoke0(Native Method) at sun.reflect.NativeMethodAccessorImpl.invoke(NativeMethodAccessorImpl.java:62) at sun.reflect.DelegatingMethodAccessorImpl.invoke(DelegatingMethodAccessorImpl.java:43) at java.lang.reflect.Method.invoke(Method.java:498) at com.air.lang.reflect.ReflectTest.testReflection(ReflectTest.java:82) // 下面是junit用反射调用这个方法的栈 at sun.reflect.NativeMethodAccessorImpl.invoke0(Native Method) at sun.reflect.NativeMethodAccessorImpl.invoke(NativeMethodAccessorImpl.java:62) at sun.reflect.DelegatingMethodAccessorImpl.invoke(DelegatingMethodAccessorImpl.java:43) at java.lang.reflect.Method.invoke(Method.java:498) at org.junit.internal.runners.TestMethod.invoke(TestMethod.java:68) o = 10
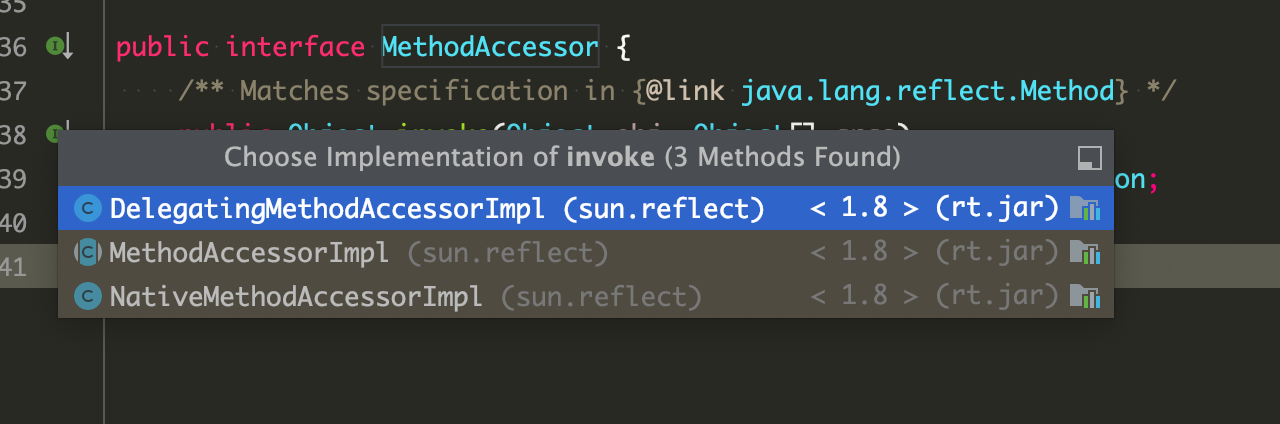
// java.lang.reflect.Method#invoke @CallerSensitive public Object invoke(Object obj, Object... args) throws IllegalAccessException, IllegalArgumentException, InvocationTargetException { if (!override) { if (!Reflection.quickCheckMemberAccess(clazz, modifiers)) { Class<?> caller = Reflection.getCallerClass(); checkAccess(caller, clazz, obj, modifiers); } } MethodAccessor ma = methodAccessor; // read volatile if (ma == null) { ma = acquireMethodAccessor(); } return ma.invoke(obj, args); }
最终调用是委托给了MethodAccessor,这是java中的一个接口:
1 2 3 4 5 6 7 8 9 10 11 12 13
// sun.reflect.MethodAccessor
/** This interface provides the declaration for java.lang.reflect.Method.invoke(). Each Method object is configured with a (possibly dynamically-generated) class which implements this interface. */
publicinterfaceMethodAccessor{ /** Matches specification in {@link java.lang.reflect.Method} */ public Object invoke(Object obj, Object[] args) throws IllegalArgumentException, InvocationTargetException; }
Before Java 1.4 Method.invoke worked through a JNI call to VM runtime.
Since Java 1.4 Method.invoke uses dynamic bytecode generation if a method is called more than 15 times (configurable via sun.reflect.inflationThreshold system property).
// sun.reflect.NativeMethodAccessorImpl#invoke public Object invoke(Object obj, Object[] args) throws IllegalArgumentException, InvocationTargetException { // We can't inflate methods belonging to vm-anonymous classes because // that kind of class can't be referred to by name, hence can't be // found from the generated bytecode. if (++numInvocations > ReflectionFactory.inflationThreshold() && !ReflectUtil.isVMAnonymousClass(method.getDeclaringClass())) { MethodAccessorImpl acc = (MethodAccessorImpl) // 超过阈值之后,会切换成动态字节码的方式 // 注意,这里没有加锁 new MethodAccessorGenerator(). generateMethod(method.getDeclaringClass(), method.getName(), method.getParameterTypes(), method.getReturnType(), method.getExceptionTypes(), method.getModifiers()); // parent就是刚才说的代理DelegatingMethodAccessorImpl // 生成结束之后,这里切换成新的调用方式 parent.setDelegate(acc); }
The approach with dynamic bytecode generation is much faster since it
does not suffer from JNI overhead;
does not need to parse method signature each time, because each method invoked via Reflection has its own unique MethodAccessor;
can be further optimized, e.g. these MethodAccessors can benefit from all regular JIT optimizations like inlining, constant propagation, autoboxing elimination etc.
Note, that this optimization is implemented mostly in Java code without JVM assistance. The only thing HotSpot VM does to make this optimization possible - is skipping bytecode verification for such generated MethodAccessors. Otherwise the verifier would not allow, for example, to call private methods.
稍微改造下代码:
1 2 3 4 5 6 7 8 9 10 11 12 13
@Test @SneakyThrows publicvoidtestReflection(){ Class<?> clazz = Class.forName("com.air.lang.reflect.ReflectTest"); Method getCountMethod = clazz.getDeclaredMethod("getCount", null); final Object instance = clazz.newInstance(); for (int i = 0; i < 20; i++) { final Object o = getCountMethod.invoke(instance); System.out.println("o = " + o); } // 阻塞退出,等待输入 System.in.read(); }
程序跑起来之后,反复调用了20次,超过了默认的阈值,会自动生成字节码。
第一次输出的调用栈:
1 2 3 4 5 6 7
java.lang.RuntimeException at com.air.lang.reflect.ReflectTest.getCount(ReflectTest.java:21) at sun.reflect.NativeMethodAccessorImpl.invoke0(Native Method) at sun.reflect.NativeMethodAccessorImpl.invoke(NativeMethodAccessorImpl.java:62) at sun.reflect.DelegatingMethodAccessorImpl.invoke(DelegatingMethodAccessorImpl.java:43) at java.lang.reflect.Method.invoke(Method.java:498) at com.air.lang.reflect.ReflectTest.testReflection(ReflectTest.java:83)
最后一次输出的调用栈:
1 2 3 4 5 6
java.lang.RuntimeException at com.air.lang.reflect.ReflectTest.getCount(ReflectTest.java:21) at sun.reflect.GeneratedMethodAccessor1.invoke(Unknown Source) at sun.reflect.DelegatingMethodAccessorImpl.invoke(DelegatingMethodAccessorImpl.java:43) at java.lang.reflect.Method.invoke(Method.java:498) at com.air.lang.reflect.ReflectTest.testReflection(ReflectTest.java:83)
// sun.reflect.DelegatingClassLoader // NOTE: this class's name and presence are known to the virtual // machine as of the fix for 4474172. classDelegatingClassLoaderextendsClassLoader{ DelegatingClassLoader(ClassLoader parent) { super(parent); } }
// jdk.internal.reflect.ClassDefiner /** Utility class which assists in calling defineClass() by creating a new class loader which delegates to the one needed in order for proper resolution of the given bytecodes to occur. */
/** <P> We define generated code into a new class loader which delegates to the defining loader of the target class. It is necessary for the VM to be able to resolve references to the target class from the generated bytecodes, which could not occur if the generated code was loaded into the bootstrap class loader. </P> <P> There are two primary reasons for creating a new loader instead of defining these bytecodes directly into the defining loader of the target class: first, it avoids any possible security risk of having these bytecodes in the same loader. Second, it allows the generated bytecodes to be unloaded earlier than would otherwise be possible, decreasing run-time footprint. </P> */ static Class<?> defineClass(String name, byte[] bytes, int off, int len, final ClassLoader parentClassLoader) { ClassLoader newLoader = AccessController.doPrivileged( new PrivilegedAction<ClassLoader>() { public ClassLoader run(){ returnnew DelegatingClassLoader(parentClassLoader); } }); return JLA.defineClass(newLoader, name, bytes, null, "__ClassDefiner__"); } }
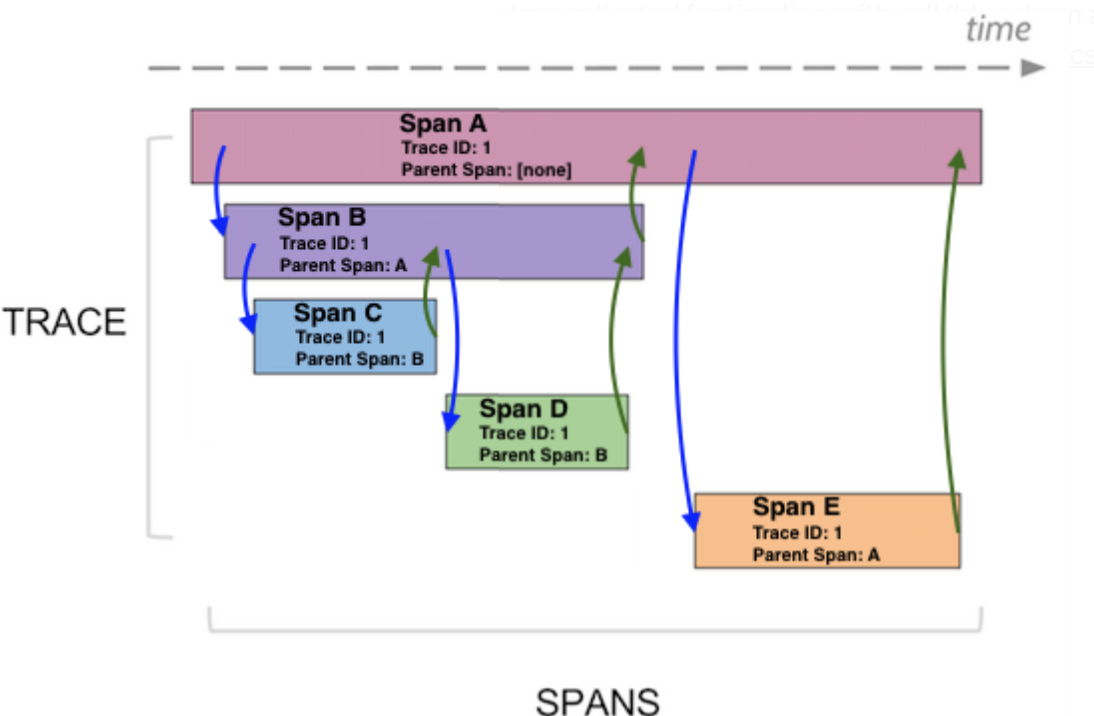
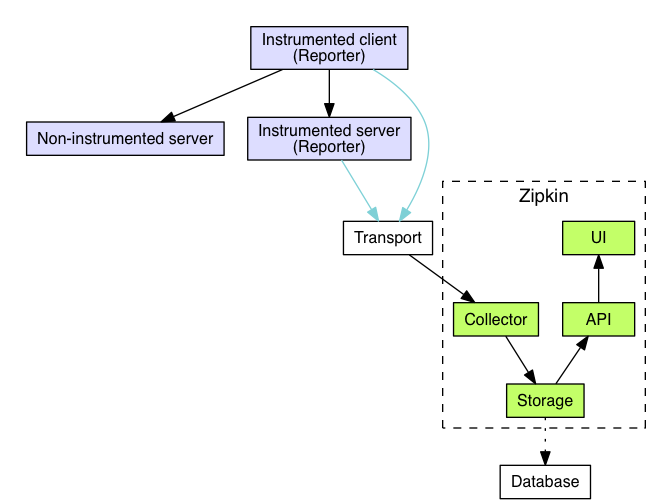
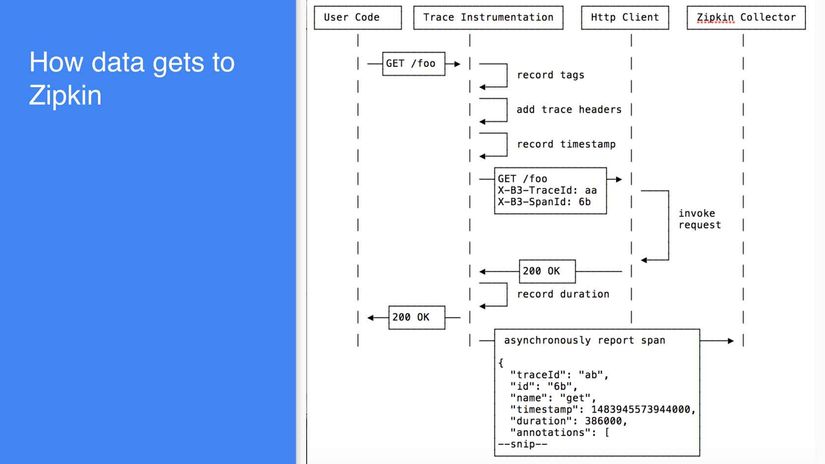
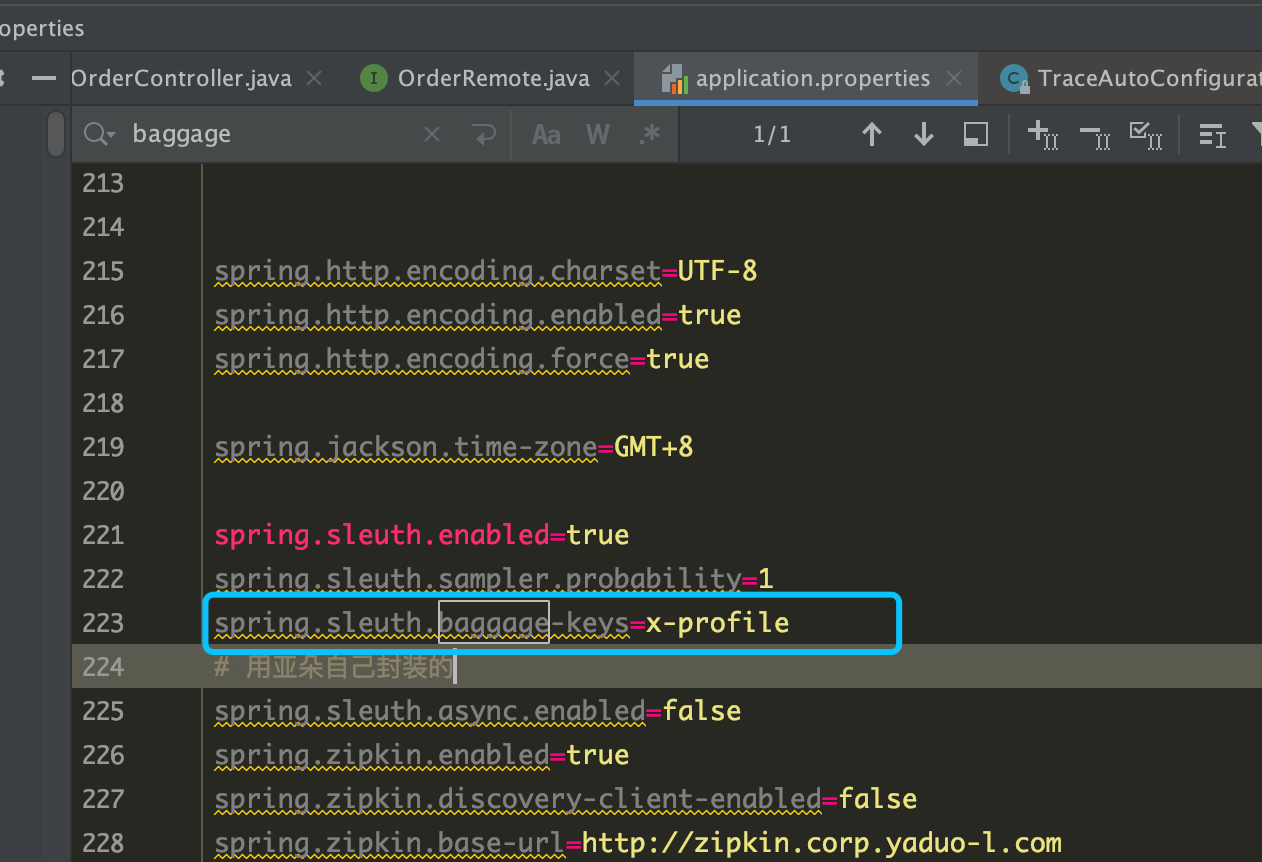
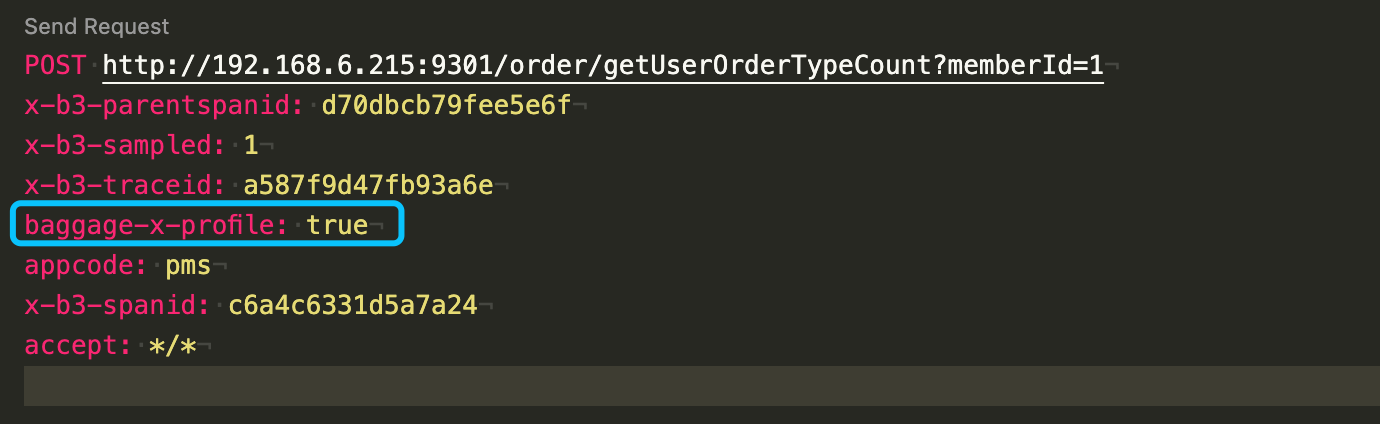
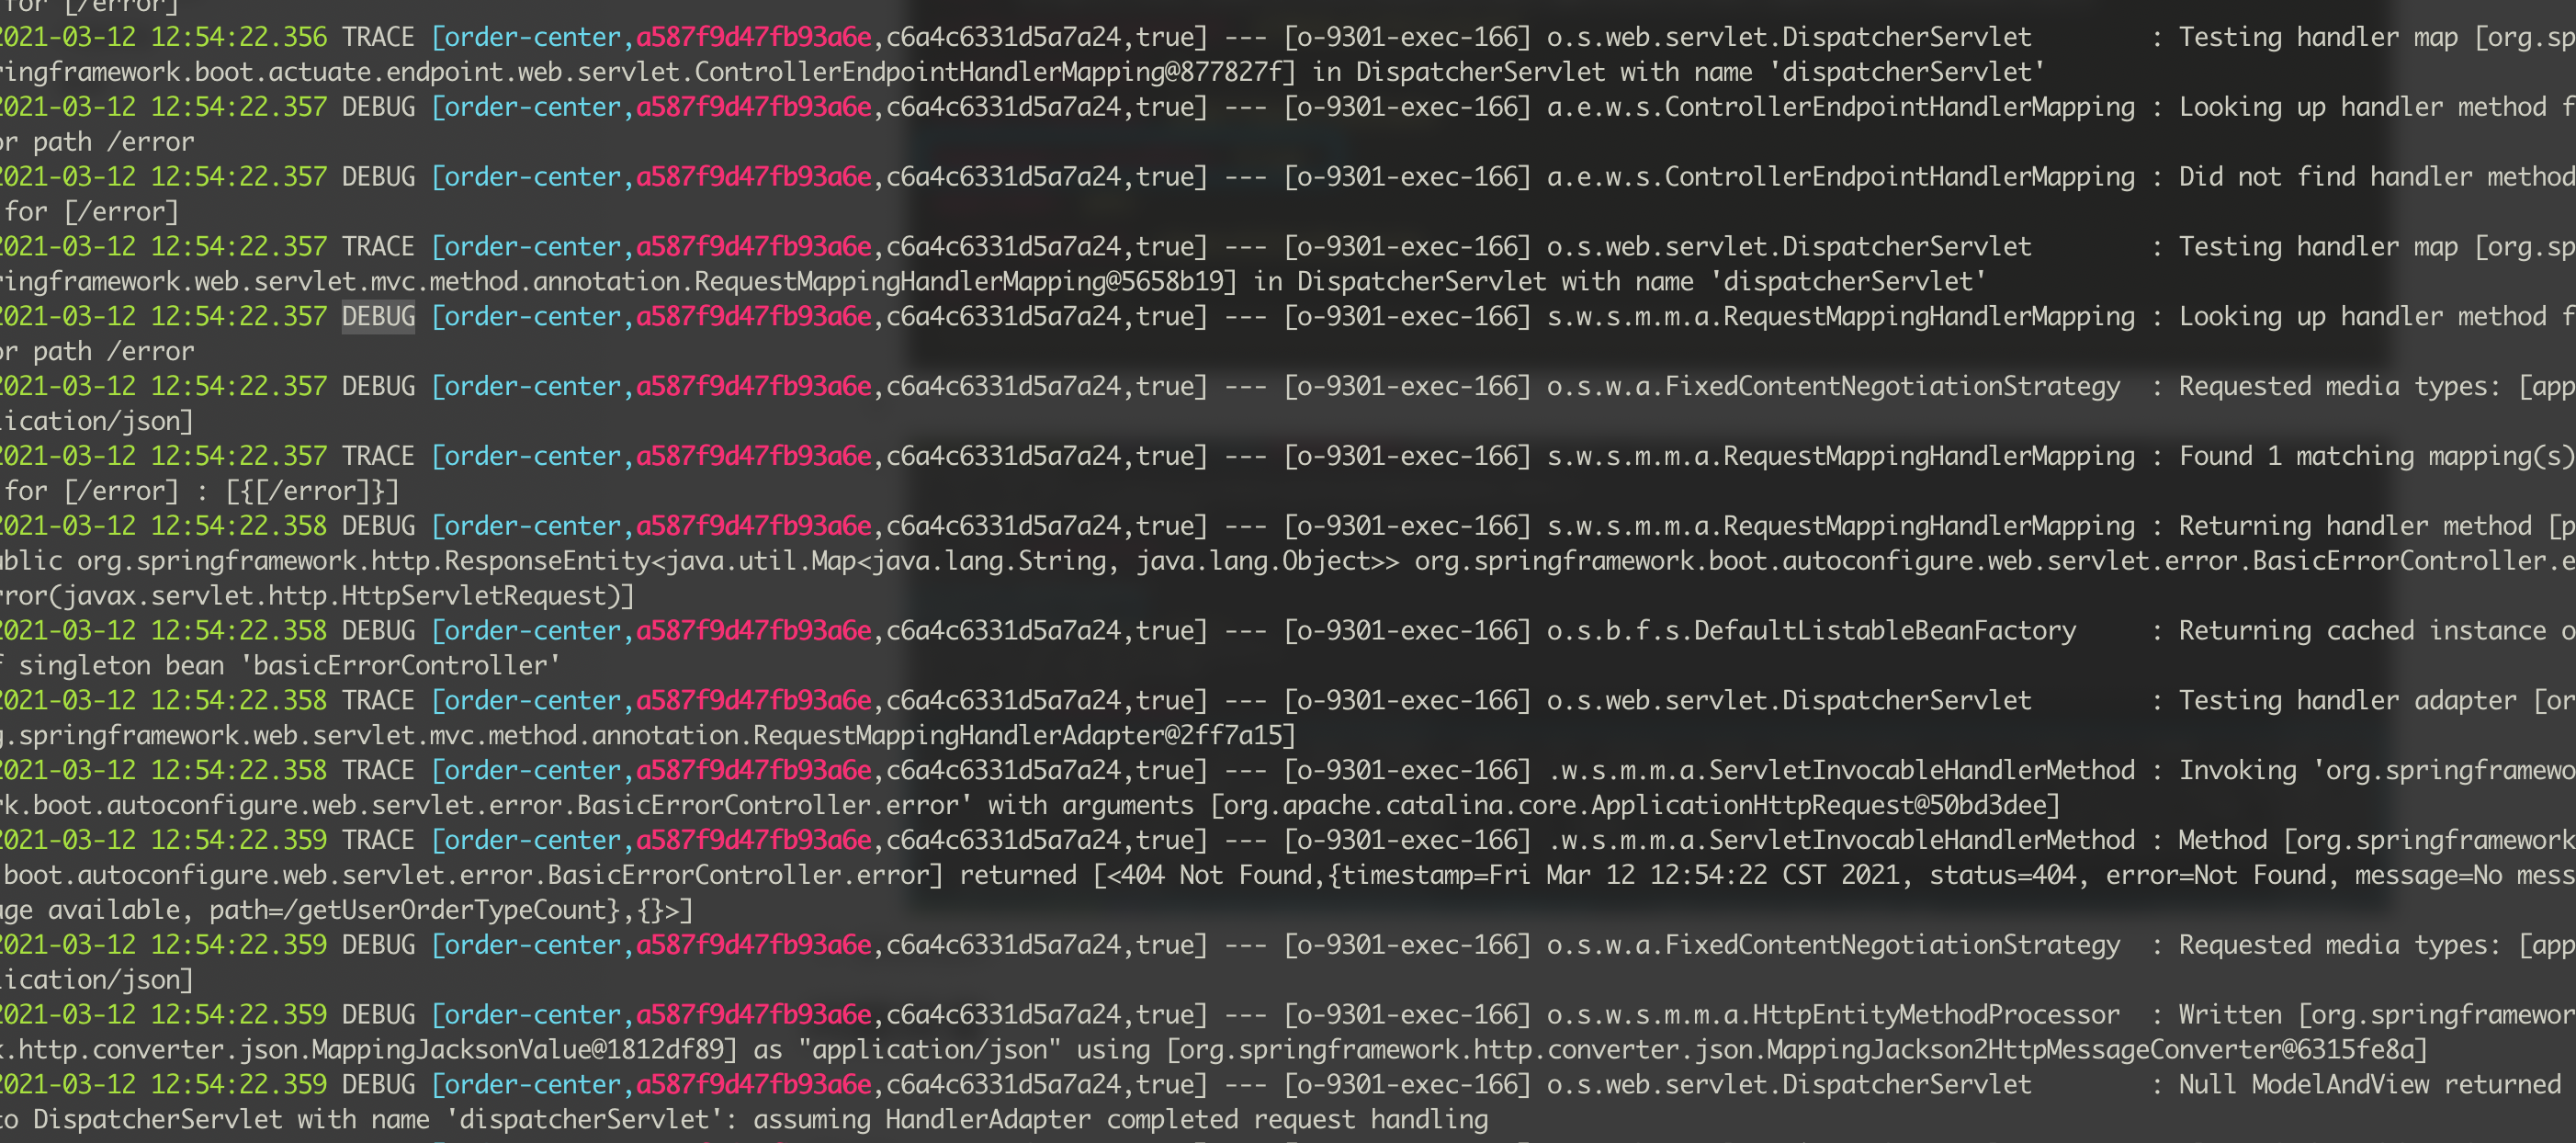
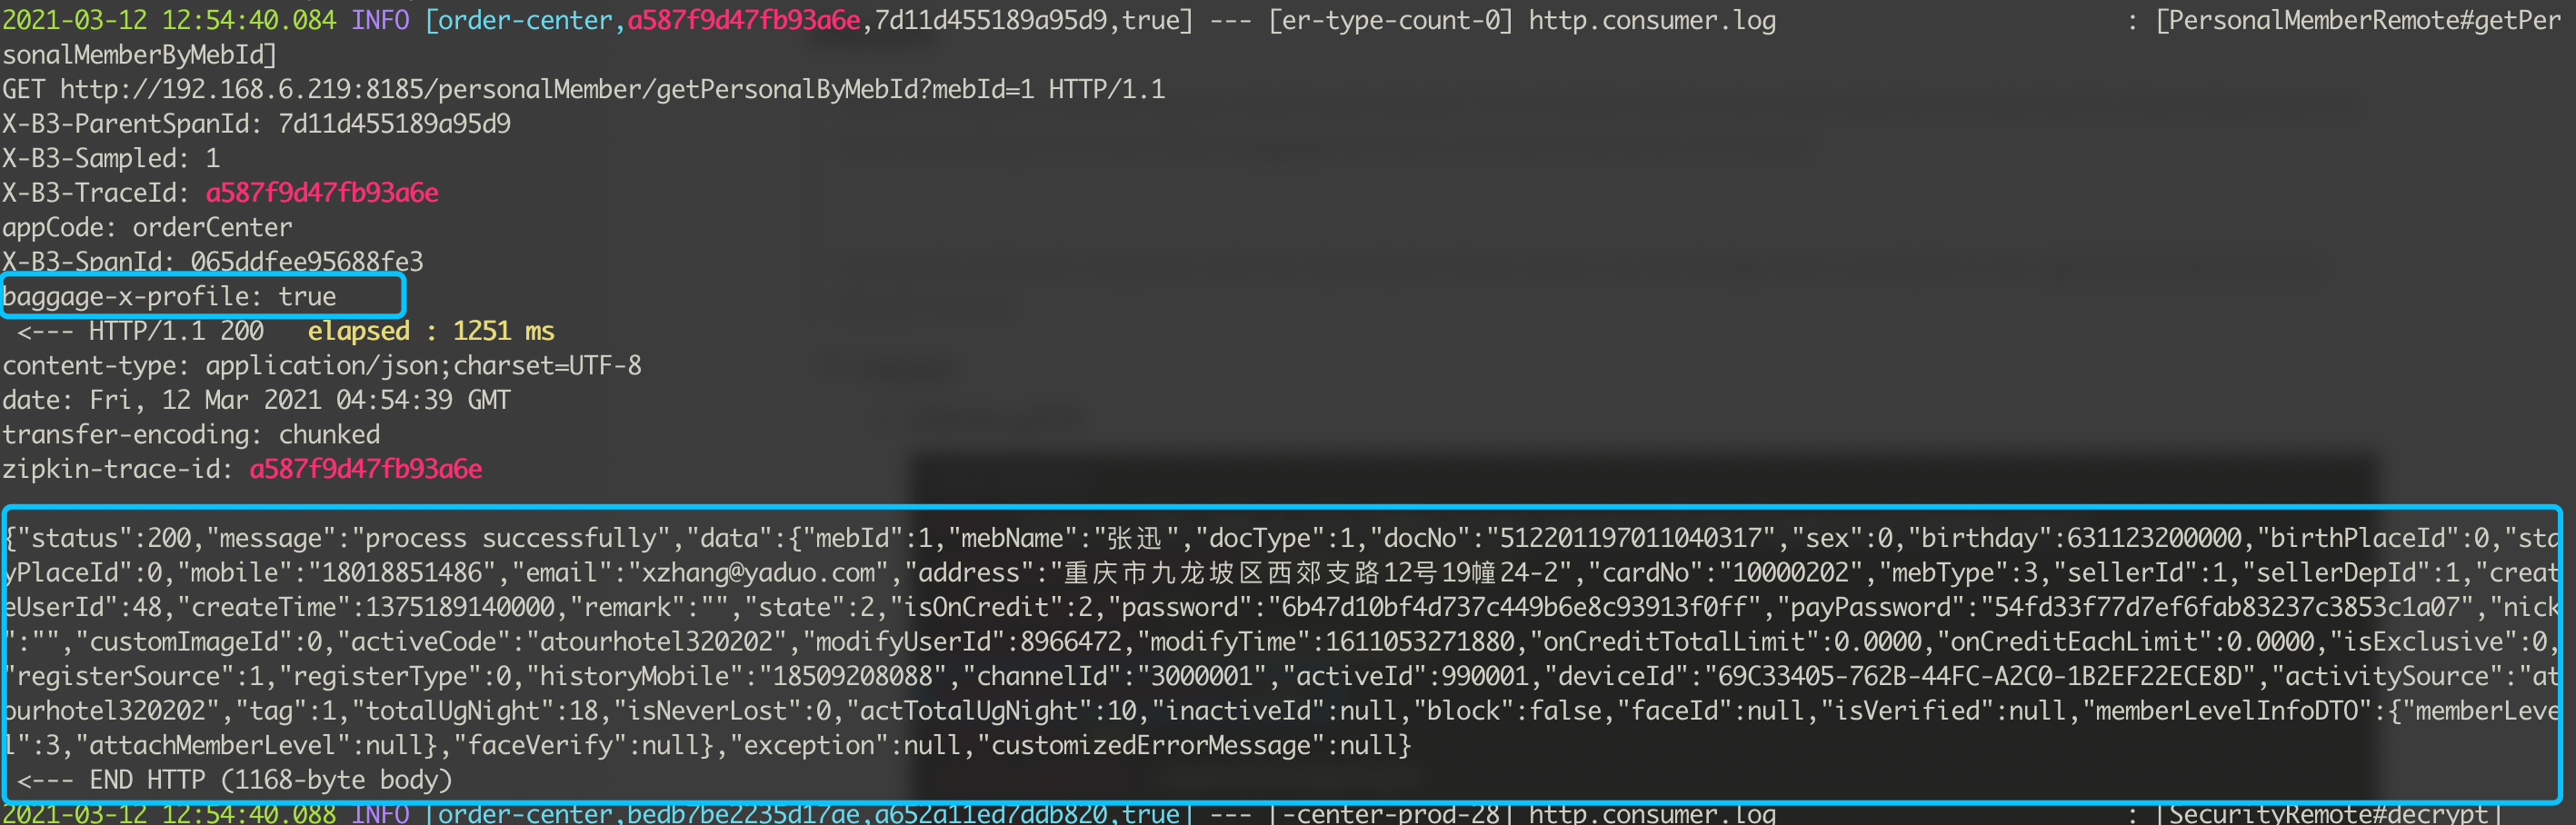
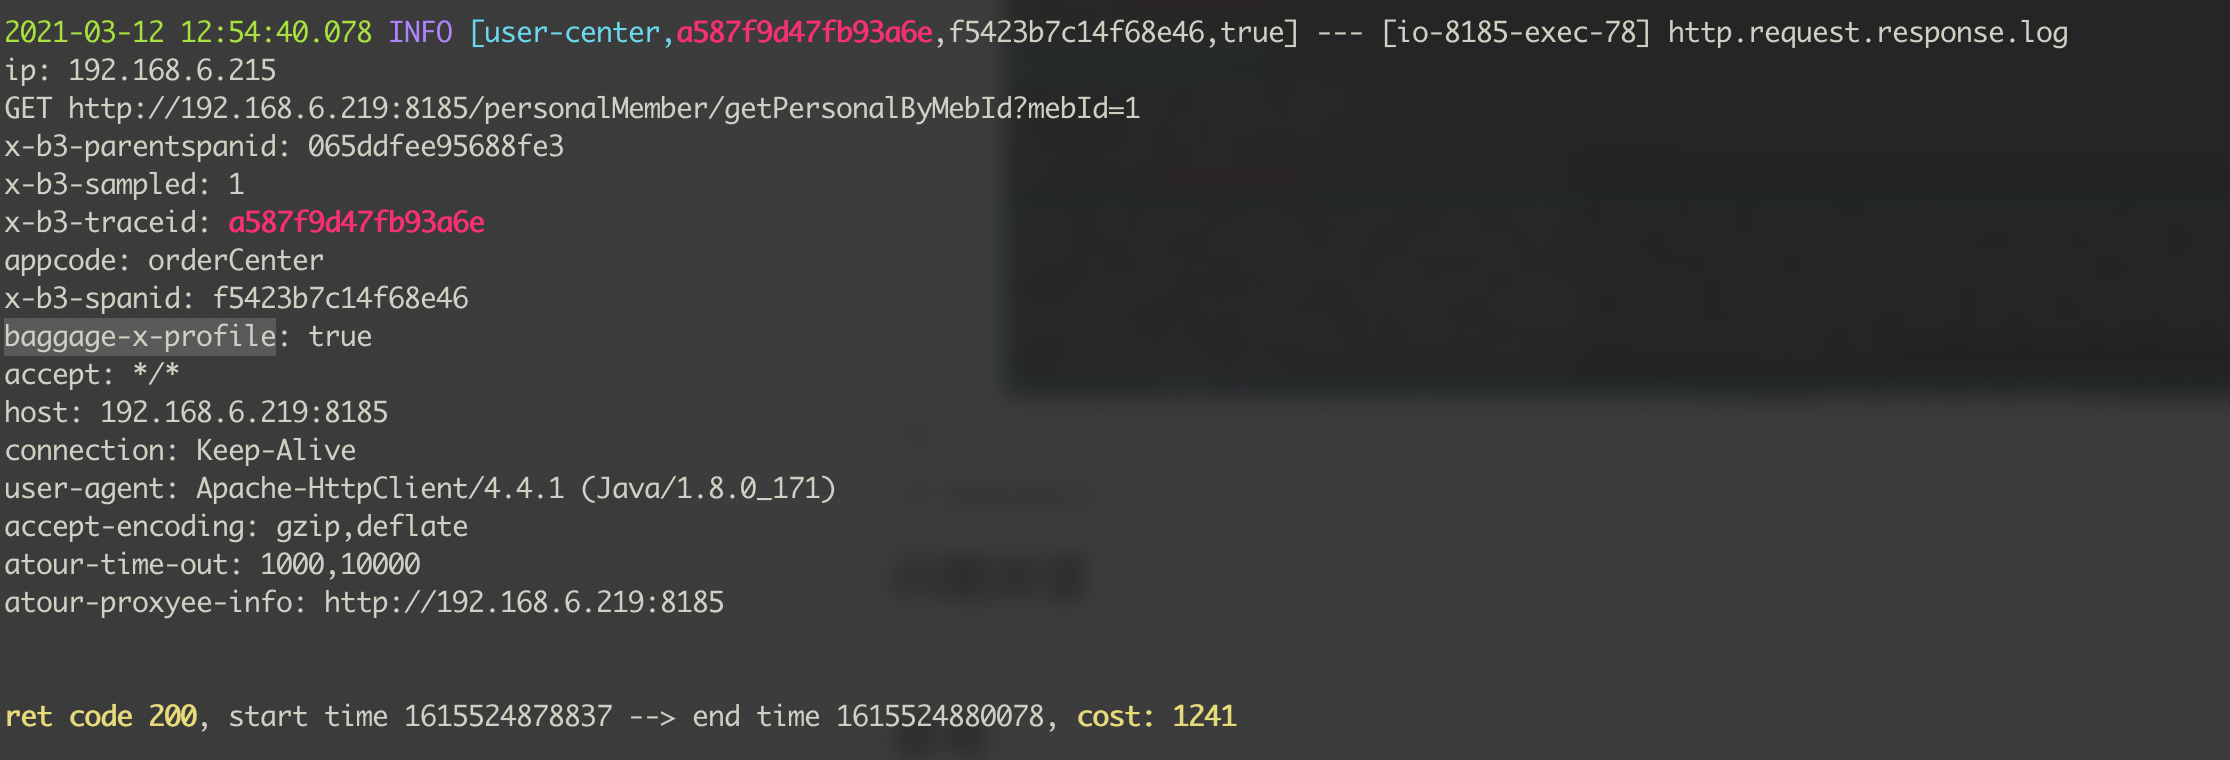
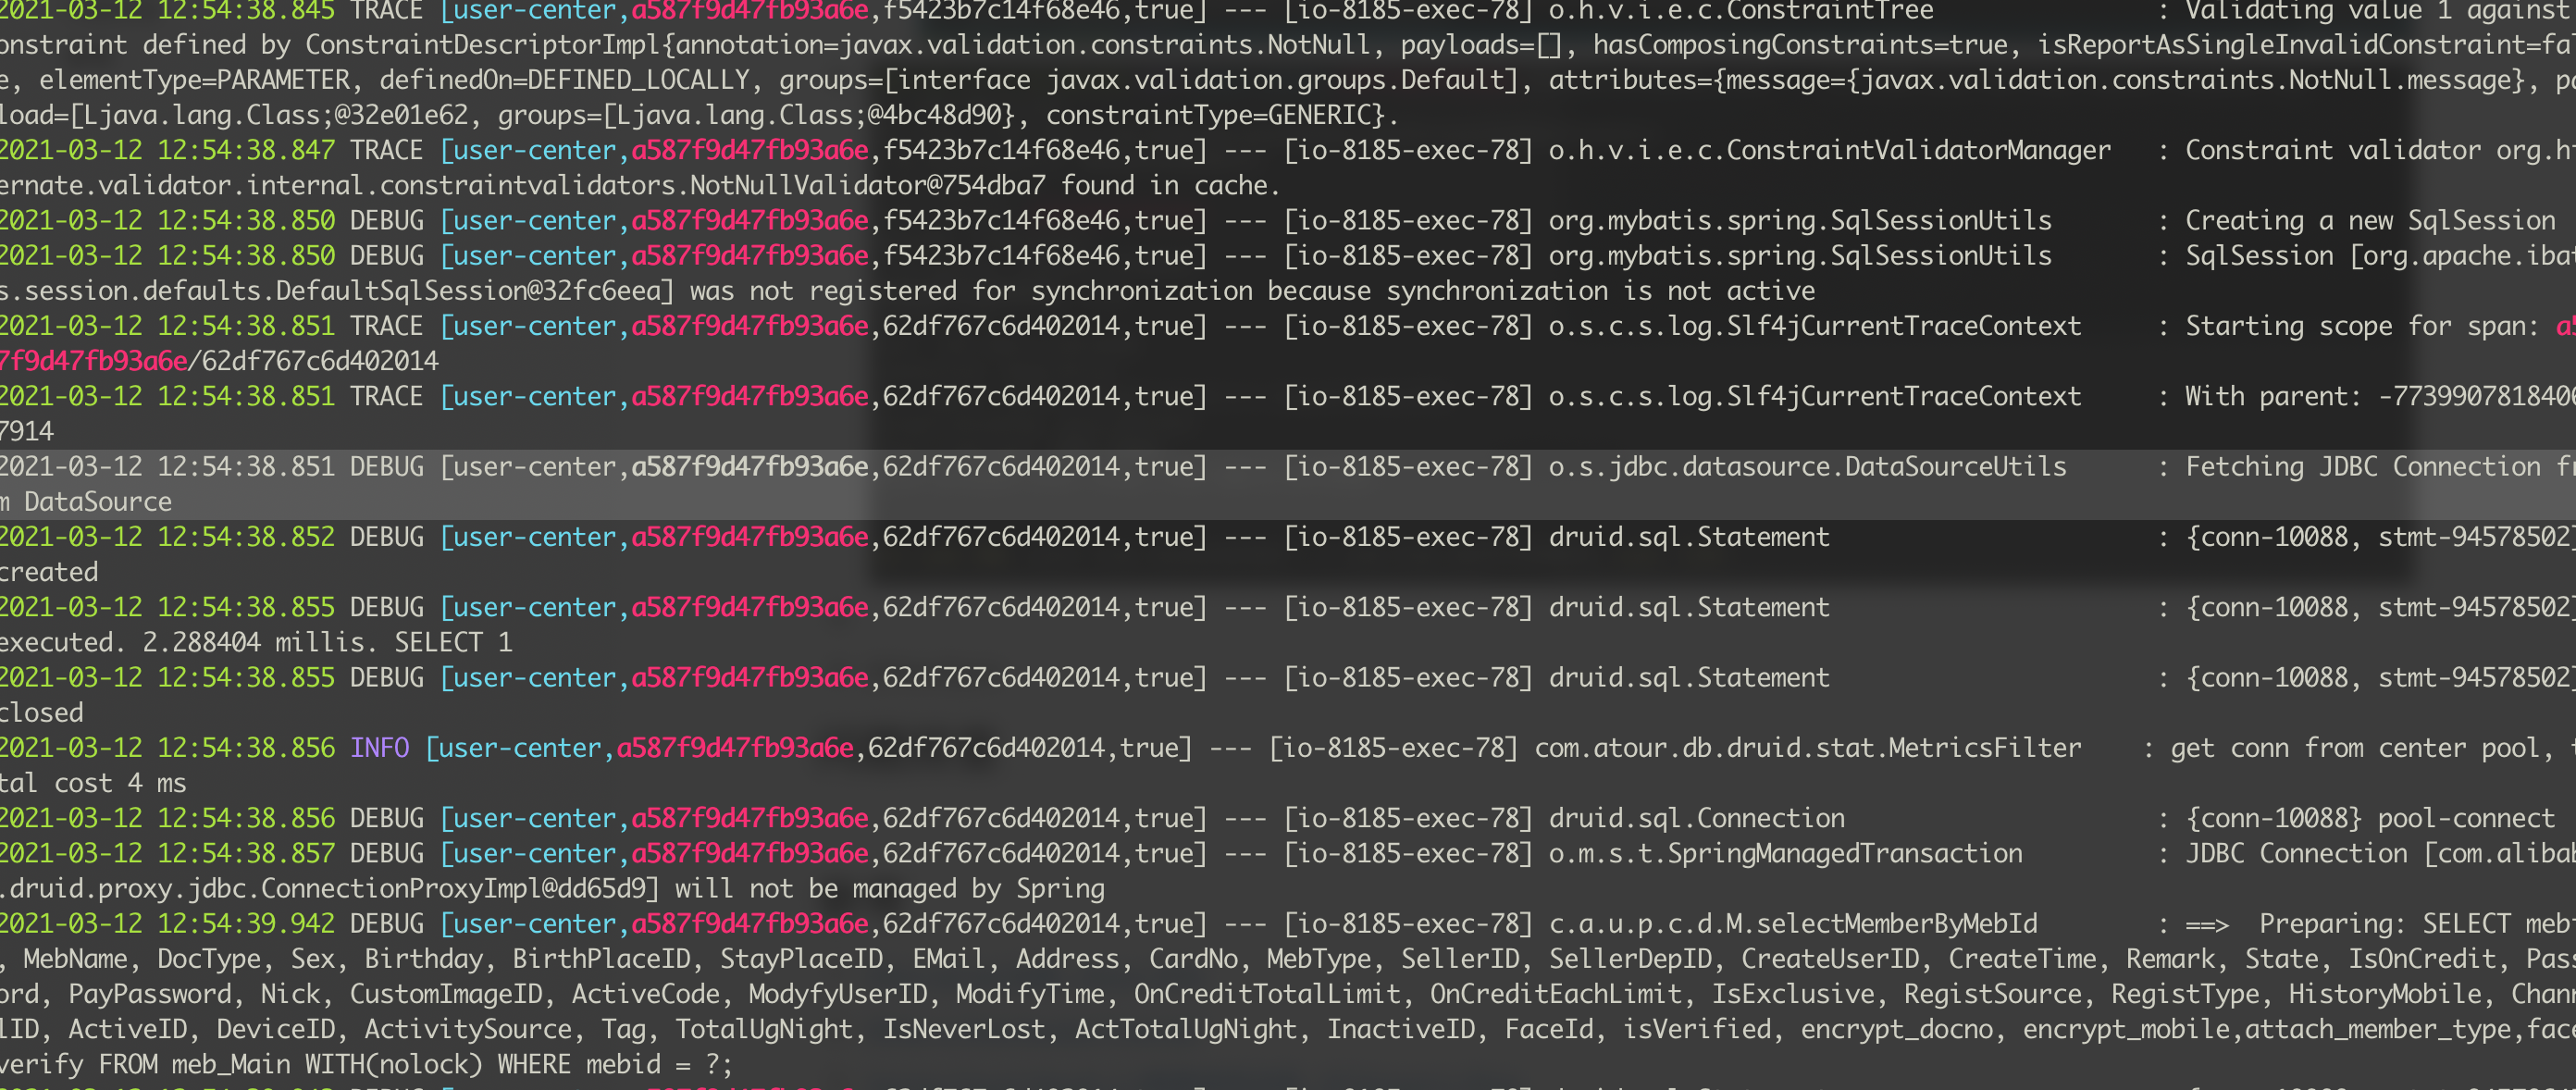
Sleuth configures everything you need to get started. This includes where trace data (spans) are reported to, how many traces to keep (sampling), if remote fields (baggage) are sent, and which libraries are traced.
Spring Cloud Sleuth integrates with the OpenZipkin Brave tracer via the bridge that is available in the spring-cloud-sleuth-brave module.
// brave.propagation.CurrentTraceContext /** * Decorates the input such that the {@link #get() current trace context} at the time a task is * scheduled is made current when the task is executed. */ public ExecutorService executorService(ExecutorService delegate){ classCurrentTraceContextExecutorServiceextendsbrave.internal.WrappingExecutorService{
/** Wraps the input so that it executes with the same context as now. */ public <C> Callable<C> wrap(Callable<C> task){ final TraceContext invocationContext = get(); classCurrentTraceContextCallableimplementsCallable<C> { @Overridepublic C call()throws Exception { try (Scope scope = maybeScope(invocationContext)) { return task.call(); } } } returnnew CurrentTraceContextCallable(); }
// org.apache.catalina.startup.Catalina#start /** * Start a new server instance. */ publicvoidstart(){
if (getServer() == null) { // 首次会走到这里,负责加载web.xml,初始化对应的组件 load(); }
if (getServer() == null) { log.fatal("Cannot start server. Server instance is not configured."); return; }
long t1 = System.nanoTime();
// Start the new server try { // 调用server的start方法 getServer().start(); } catch (LifecycleException e) { log.fatal(sm.getString("catalina.serverStartFail"), e); try { getServer().destroy(); } catch (LifecycleException e1) { log.debug("destroy() failed for failed Server ", e1); } return; }
long t2 = System.nanoTime(); if(log.isInfoEnabled()) { log.info("Server startup in " + ((t2 - t1) / 1000000) + " ms"); }
// Register shutdown hook if (useShutdownHook) { if (shutdownHook == null) { shutdownHook = new CatalinaShutdownHook(); } Runtime.getRuntime().addShutdownHook(shutdownHook);
// If JULI is being used, disable JULI's shutdown hook since // shutdown hooks run in parallel and log messages may be lost // if JULI's hook completes before the CatalinaShutdownHook() LogManager logManager = LogManager.getLogManager(); if (logManager instanceof ClassLoaderLogManager) { ((ClassLoaderLogManager) logManager).setUseShutdownHook( false); } }
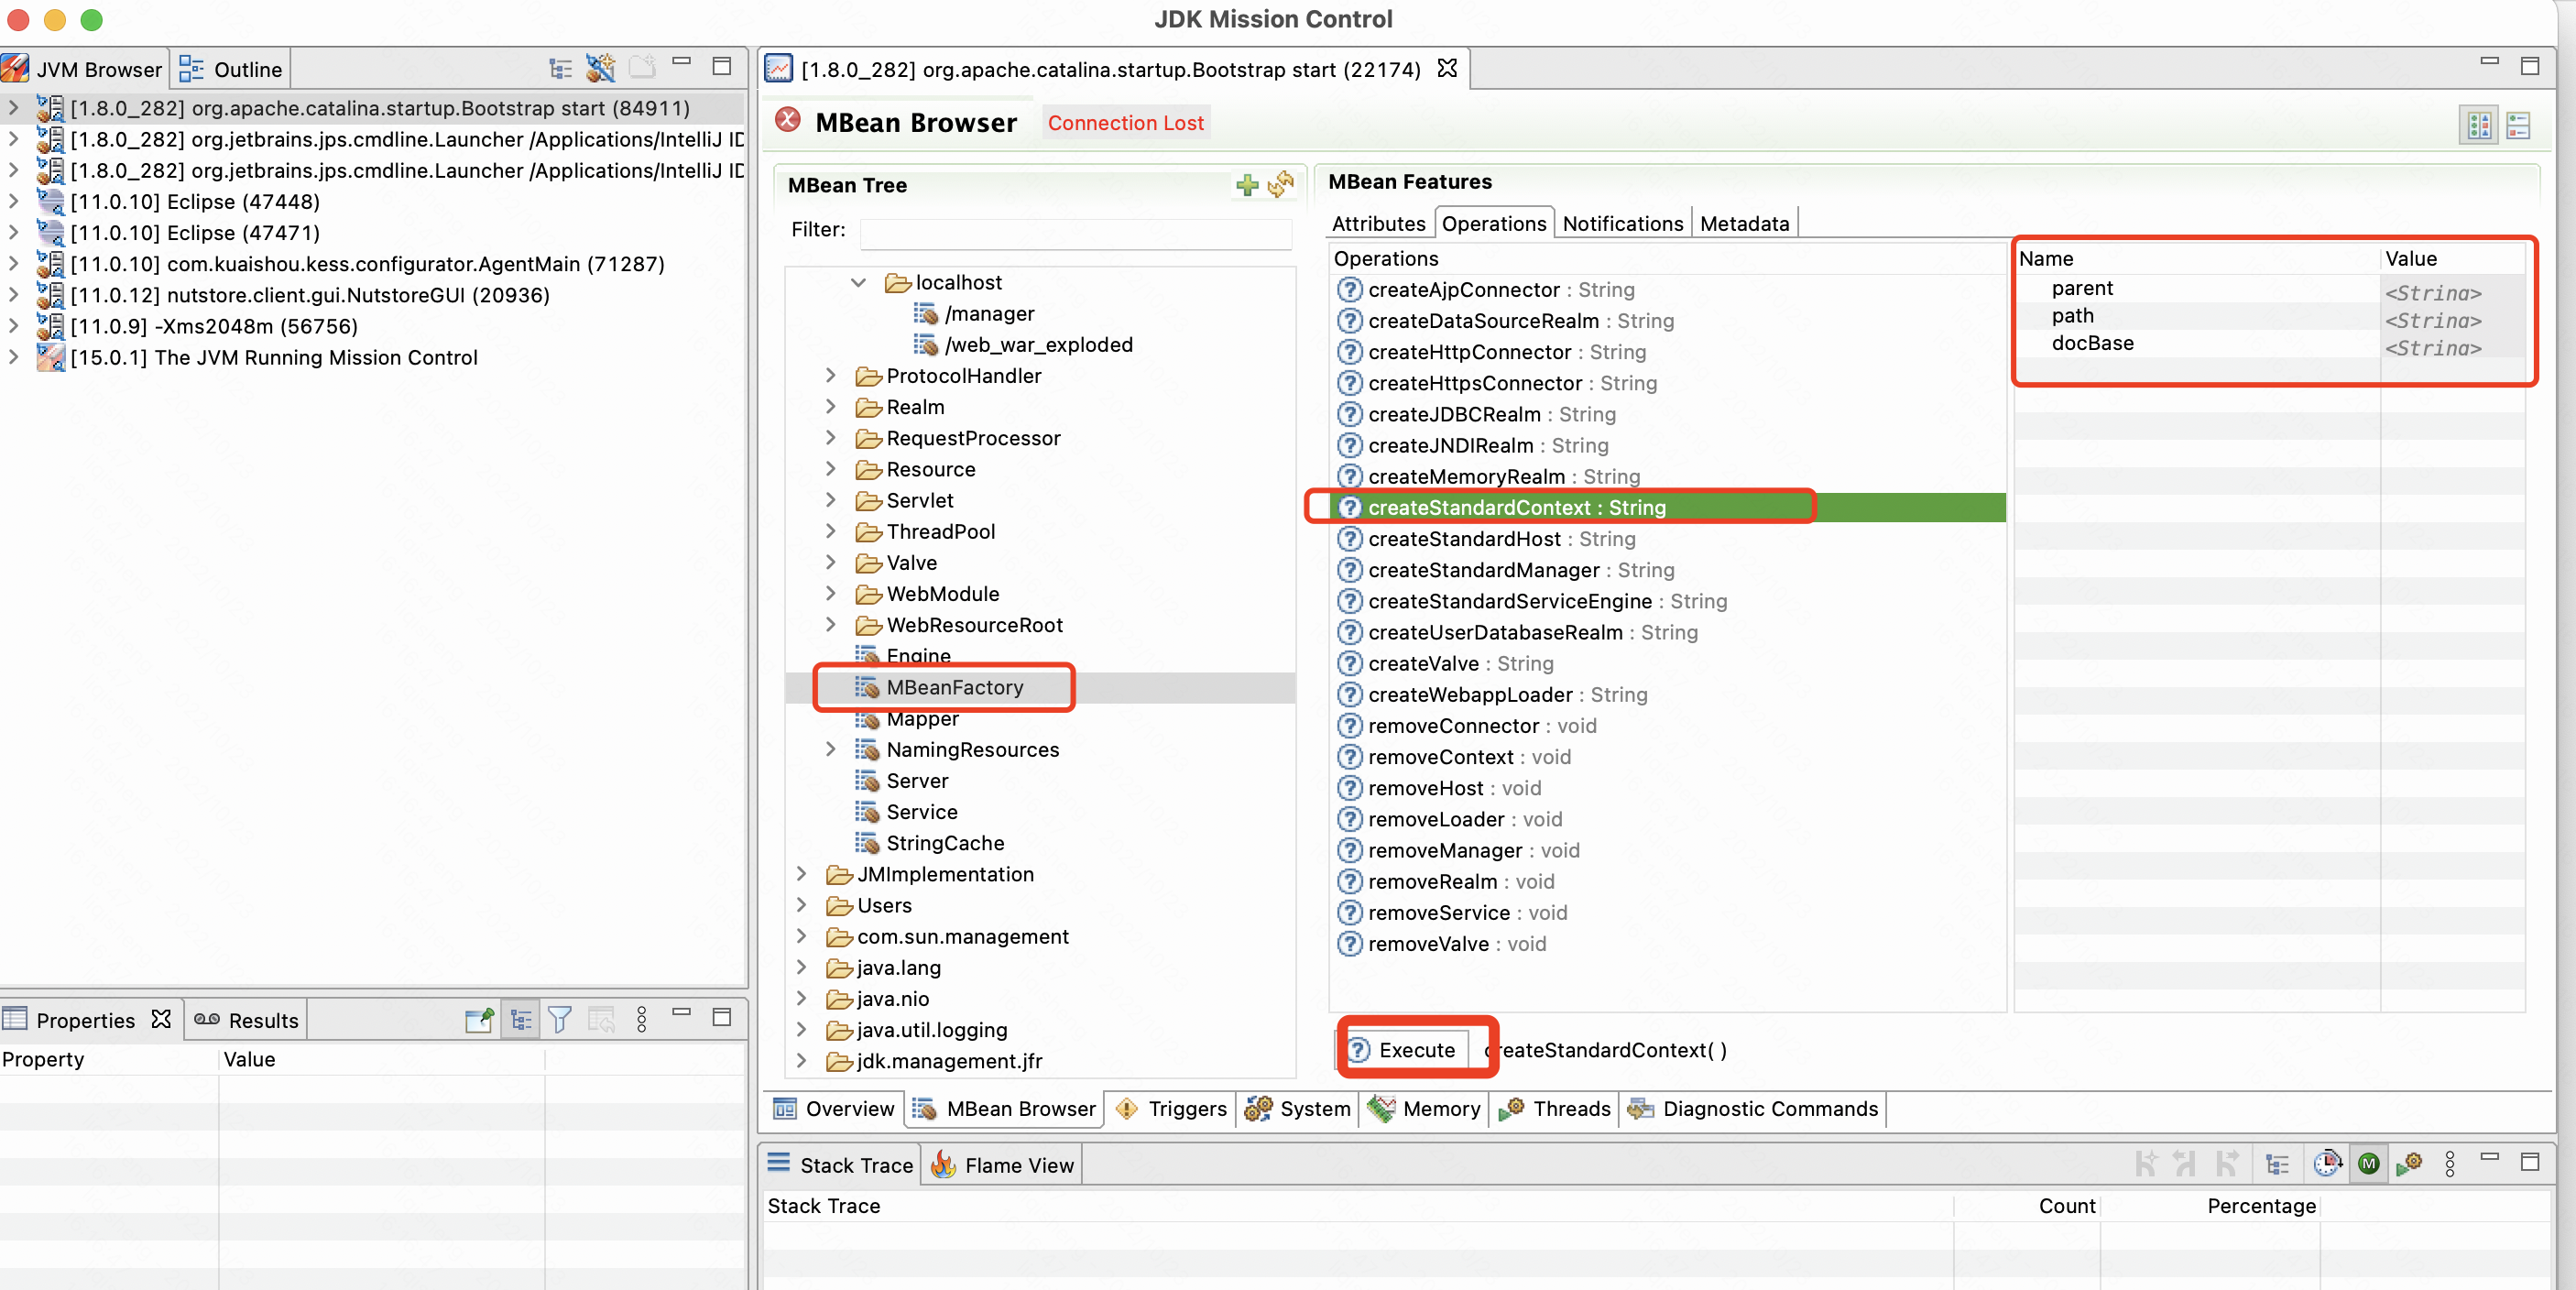
// Register global String cache // Note although the cache is global, if there are multiple Servers // present in the JVM (may happen when embedding) then the same cache // will be registered under multiple names onameStringCache = register(new StringCache(), "type=StringCache");
// Register the MBeanFactory MBeanFactory factory = new MBeanFactory(); factory.setContainer(this); onameMBeanFactory = register(factory, "type=MBeanFactory");
// Register the naming resources globalNamingResources.init();
// Populate the extension validator with JARs from common and shared // class loaders // 省略... // Initialize our defined Services for (int i = 0; i < services.length; i++) { services[i].init(); } }
// org.apache.catalina.core.StandardServer#await /** * Wait until a proper shutdown command is received, then return. * This keeps the main thread alive - the thread pool listening for http * connections is daemon threads. */ @Override publicvoidawait(){ // Negative values - don't wait on port - tomcat is embedded or we just don't like ports if( port == -2 ) { // undocumented yet - for embedding apps that are around, alive. return; } // port没有定义的话,就直接没10s检查一次是否结束服务 // 这里使用了变量awaitThread来标识结束,当然他是volatile的 if( port==-1 ) { try { awaitThread = Thread.currentThread(); while(!stopAwait) { try { Thread.sleep( 10000 ); } catch( InterruptedException ex ) { // continue and check the flag } } } finally { awaitThread = null; } return; }
// 这里会启动一个Server,监听shutdown的端口,和发过来的命令 // Set up a server socket to wait on try { awaitSocket = new ServerSocket(port, 1, InetAddress.getByName(address)); } catch (IOException e) { log.error("StandardServer.await: create[" + address + ":" + port + "]: ", e); return; }
try { awaitThread = Thread.currentThread();
// Loop waiting for a connection and a valid command while (!stopAwait) { ServerSocket serverSocket = awaitSocket; if (serverSocket == null) { break; }
// Wait for the next connection Socket socket = null; StringBuilder command = new StringBuilder(); try { InputStream stream; long acceptStartTime = System.currentTimeMillis(); try { socket = serverSocket.accept(); socket.setSoTimeout(10 * 1000); // Ten seconds stream = socket.getInputStream(); } catch (SocketTimeoutException ste) { // This should never happen but bug 56684 suggests that // it does. log.warn(sm.getString("standardServer.accept.timeout", Long.valueOf(System.currentTimeMillis() - acceptStartTime)), ste); continue; } catch (AccessControlException ace) { log.warn("StandardServer.accept security exception: " + ace.getMessage(), ace); continue; } catch (IOException e) { if (stopAwait) { // Wait was aborted with socket.close() break; } log.error("StandardServer.await: accept: ", e); break; }
// Read a set of characters from the socket int expected = 1024; // Cut off to avoid DoS attack while (expected < shutdown.length()) { if (random == null) random = new Random(); expected += (random.nextInt() % 1024); } while (expected > 0) { int ch = -1; try { ch = stream.read(); } catch (IOException e) { log.warn("StandardServer.await: read: ", e); ch = -1; } // Control character or EOF (-1) terminates loop if (ch < 32 || ch == 127) { break; } command.append((char) ch); expected--; } } finally { // Close the socket now that we are done with it try { if (socket != null) { socket.close(); } } catch (IOException e) { // Ignore } }
// Match against our command string boolean match = command.toString().equals(shutdown); if (match) { log.info(sm.getString("standardServer.shutdownViaPort")); break; } else log.warn("StandardServer.await: Invalid command '" + command.toString() + "' received"); } } finally { ServerSocket serverSocket = awaitSocket; awaitThread = null; awaitSocket = null;
// Close the server socket and return if (serverSocket != null) { try { serverSocket.close(); } catch (IOException e) { // Ignore } } } }
➜ bin telnet localhost 8005 Trying ::1... telnet: connect to address ::1: Connection refused Trying 127.0.0.1... Connected to localhost. Escape character is '^]'. sdf Connection closed by foreign host.
# 上面的命令不对,tomcat没有反应,这里还能连接8005端口 ➜ bin telnet localhost 8005 Trying ::1... telnet: connect to address ::1: Connection refused Trying 127.0.0.1... Connected to localhost. Escape character is '^]'. SHUTDOWN Connection closed by foreign host.
# 此时tomcat已经被shutdown了 ➜ bin telnet localhost 8005 Trying ::1... telnet: connect to address ::1: Connection refused Trying 127.0.0.1... telnet: connect to address 127.0.0.1: Connection refused telnet: Unable to connect to remote host
被shutdown的同时,会在Catalina.out中打印如下的日志:
1
27-Nov-2021 21:00:14.933 INFO [main] org.apache.catalina.core.StandardServer.await A valid shutdown command was received via the shutdown port. Stopping the Server instance.
如果下次,tomcat莫名奇妙shutdown了,可以考虑下是不是被人打接口导致的。
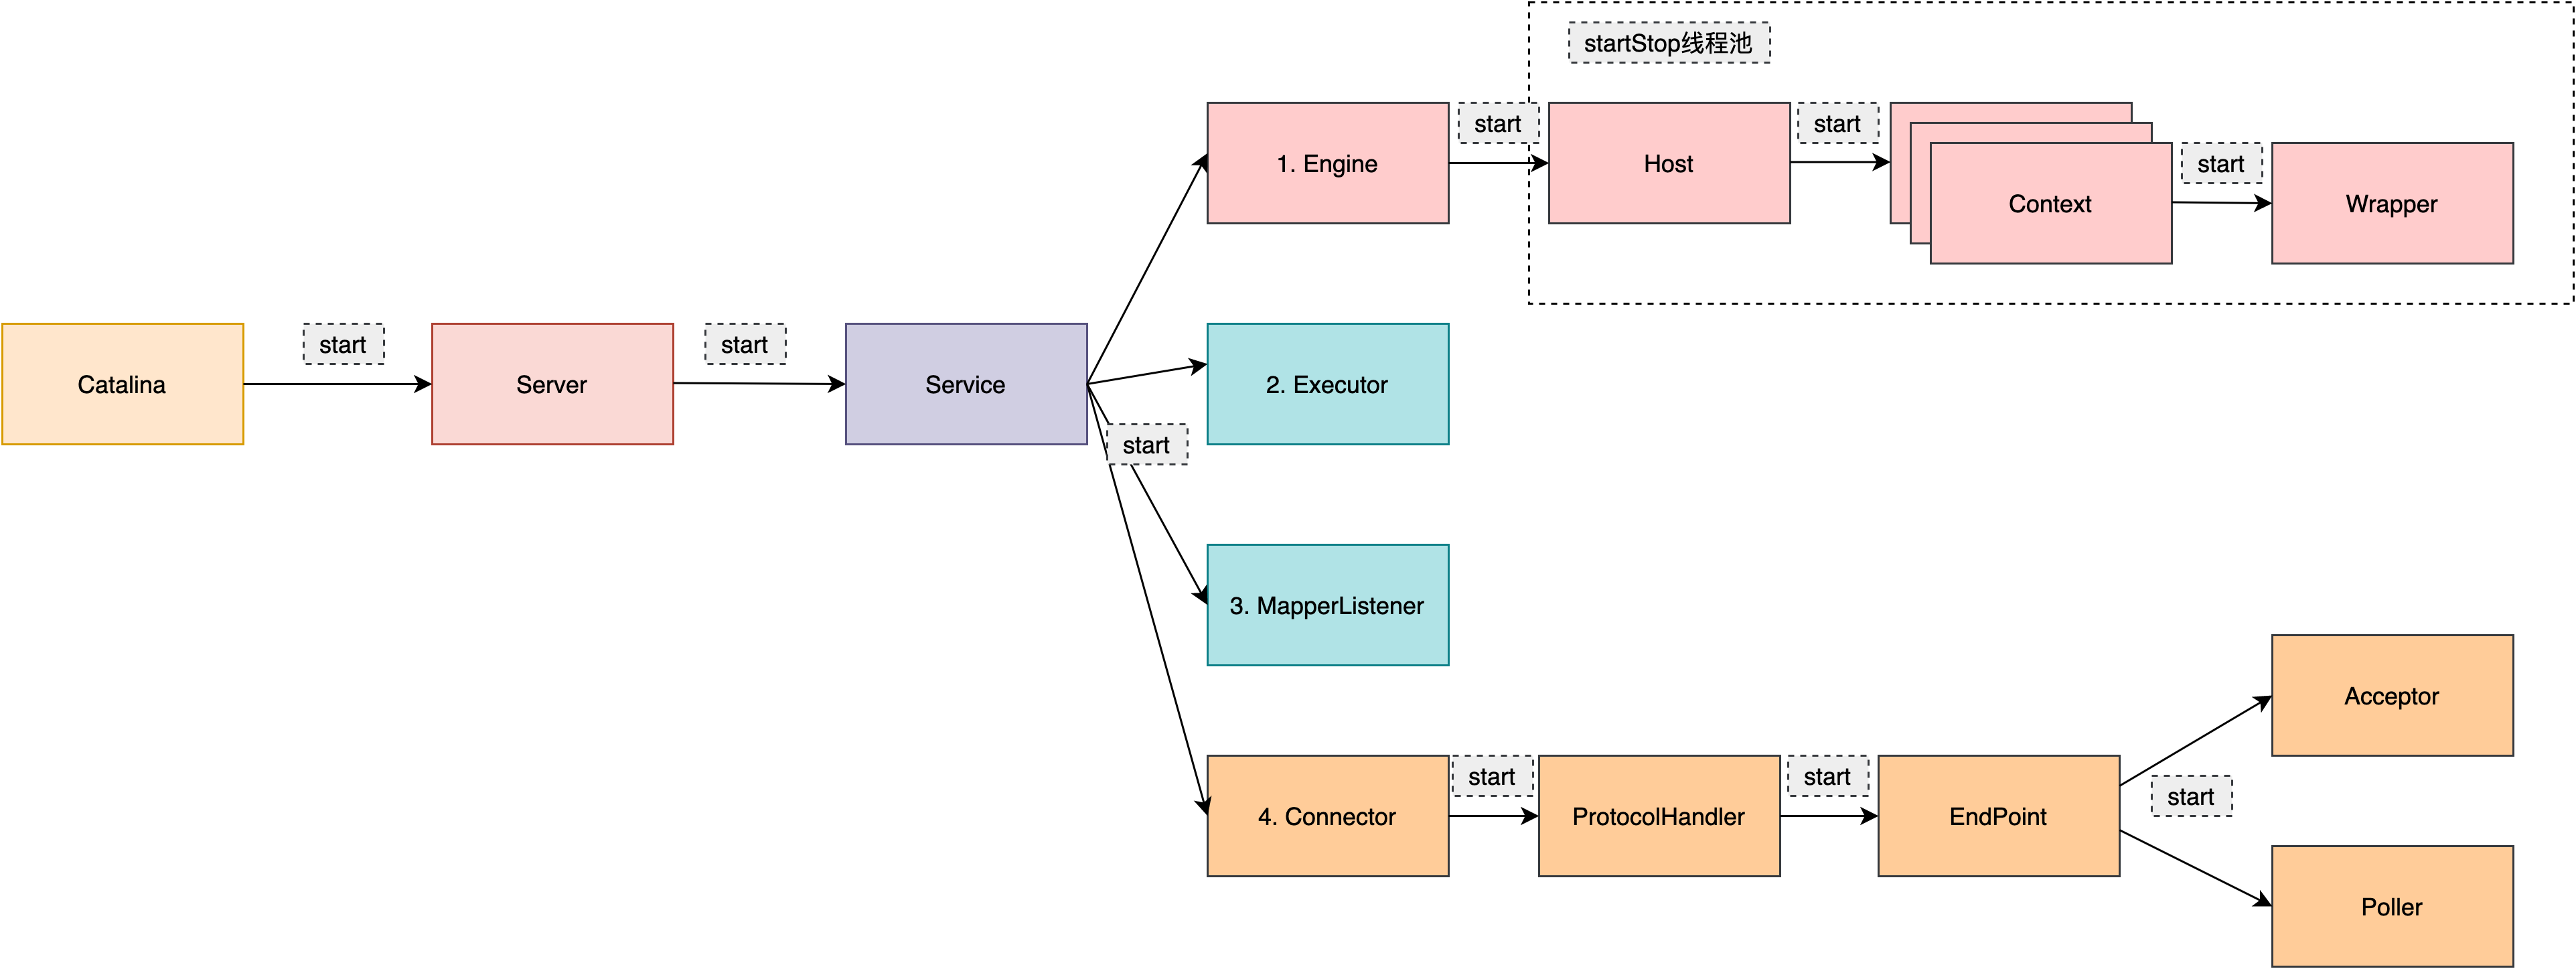
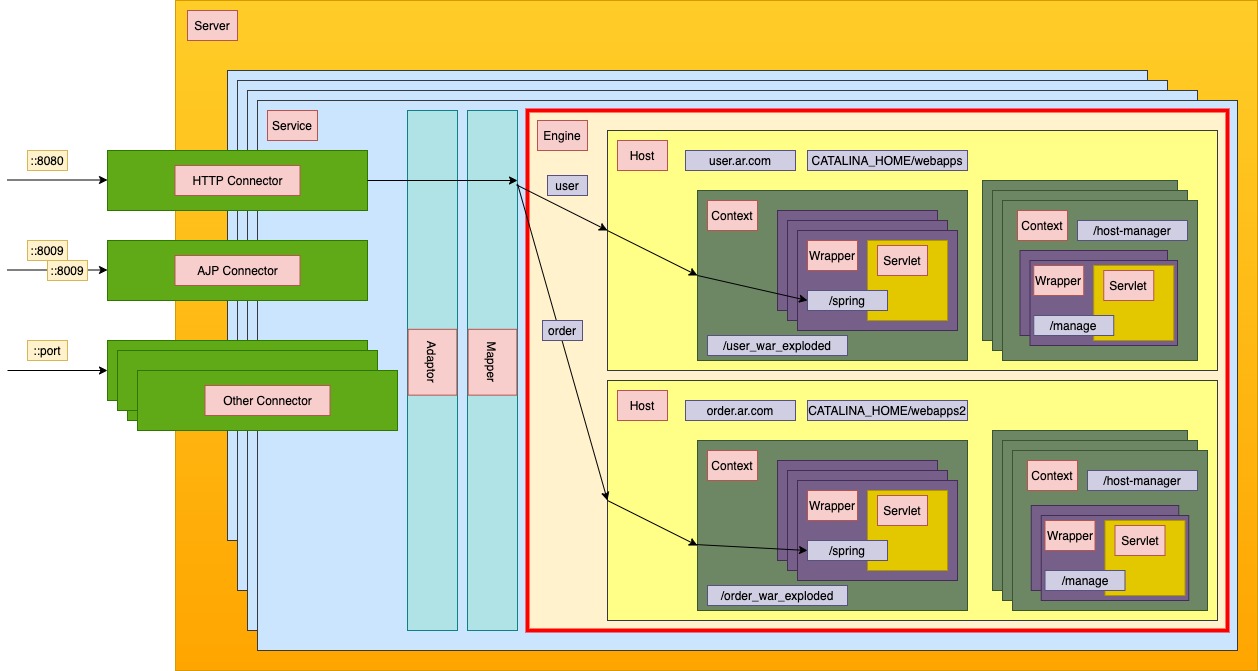
Service
A “Service” is a collection of one or more “Connectors” that share
a single “Container” Note: A “Service” is not itself a “Container”,
so you may not define subcomponents such as “Valves” at this level.
/** * The set of Connectors associated with this Service. */ protected Connector connectors[] = new Connector[0]; privatefinal Object connectorsLock = new Object();
/** * Add a new Connector to the set of defined Connectors, and associate it * with this Service's Container. * * @param connector The Connector to be added */ @Override publicvoidaddConnector(Connector connector){
synchronized (connectorsLock) { // 省略 } }
重要属性变更时,会发出一个PropertyChangeEvent:
1 2 3 4 5 6 7
/** * The property change support for this component. */ protectedfinal PropertyChangeSupport support = new PropertyChangeSupport(this);
// Report this property change to interested listeners support.firePropertyChange("container", oldEngine, this.engine);
Engine
If used, an Engine is always the top level Container in a Catalina hierarchy.
It is useful in the following types of scenarios:
You wish to use Interceptors that see every single request processed by the entire engine.
You wish to run Catalina in with a standalone HTTP connector, but still want support for multiple virtual hosts.
Standard implementation of the Wrapper interface that represents an individual servlet definition. No child Containers are allowed, and the parent Container must be a Context.
55 <!--The connectors can use a shared executor, you can define one or more named thread pools--> 56 <!-- 57 <Executor name="tomcatThreadPool" namePrefix="catalina-exec-" 58 maxThreads="150" minSpareThreads="4"/> 59 -->
// org.apache.catalina.startup.ConnectorCreateRule#begin @Override publicvoidbegin(String namespace, String name, Attributes attributes) throws Exception { Service svc = (Service)digester.peek(); Executor ex = null; if ( attributes.getValue("executor")!=null ) { // 如果配置executor属性,则从service中,查找对应的executor ex = svc.getExecutor(attributes.getValue("executor")); } Connector con = new Connector(attributes.getValue("protocol")); if (ex != null) { // 设置executor为共享的 setExecutor(con, ex); } String sslImplementationName = attributes.getValue("sslImplementationName"); if (sslImplementationName != null) { setSSLImplementationName(con, sslImplementationName); } digester.push(con); }
executor
A reference to the name in an Executor element. If this attribute is set, and the named executor exists, the connector will use the executor, and all the other thread attributes will be ignored. Note that if a shared executor is not specified for a connector then the connector will use a private, internal executor to provide the thread pool
//org.apache.catalina.core.StandardThreadExecutor#startInternal /** * Start the component and implement the requirements * of {@link org.apache.catalina.util.LifecycleBase#startInternal()}. * * @exception LifecycleException if this component detects a fatal error * that prevents this component from being used */ @Override protectedvoidstartInternal()throws LifecycleException {
taskqueue = new TaskQueue(maxQueueSize); TaskThreadFactory tf = new TaskThreadFactory(namePrefix,daemon,getThreadPriority()); // 注意,这里是tomcat自己实现的ThreadPoolExecutor executor = new ThreadPoolExecutor(getMinSpareThreads(), getMaxThreads(), maxIdleTime, TimeUnit.MILLISECONDS,taskqueue, tf); executor.setThreadRenewalDelay(threadRenewalDelay); if (prestartminSpareThreads) { executor.prestartAllCoreThreads(); } taskqueue.setParent(executor);
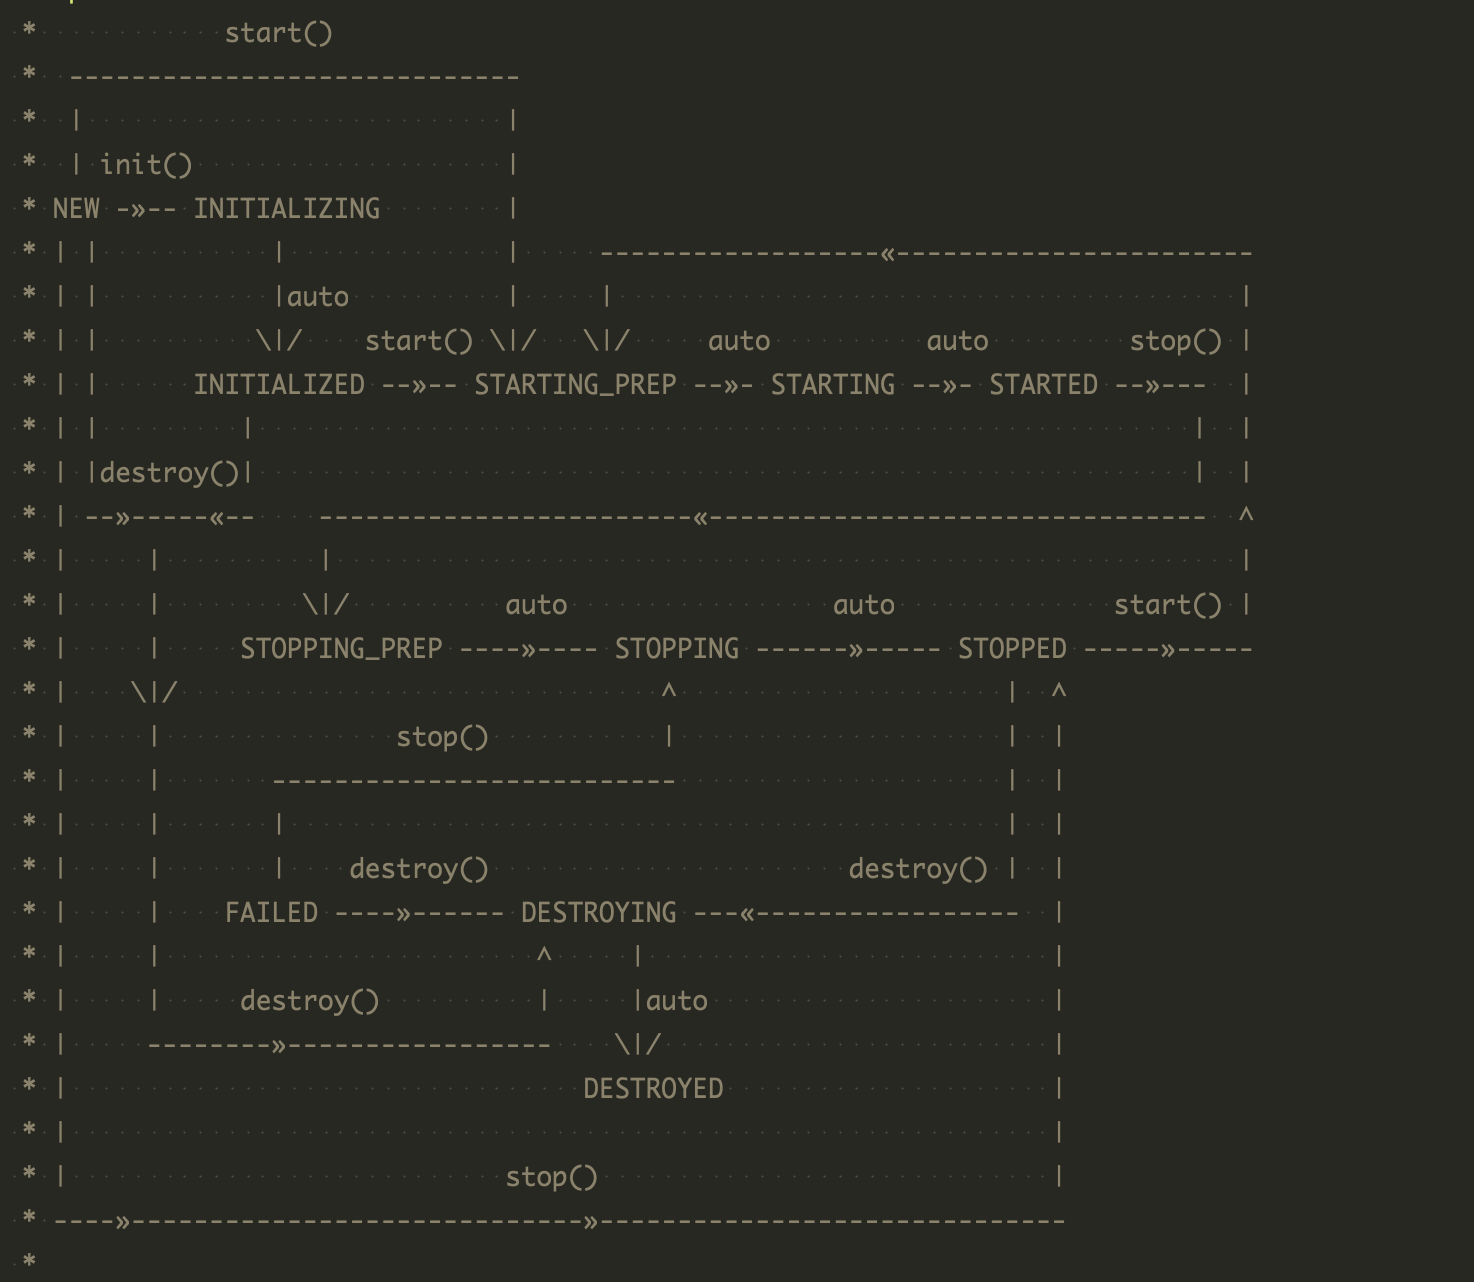
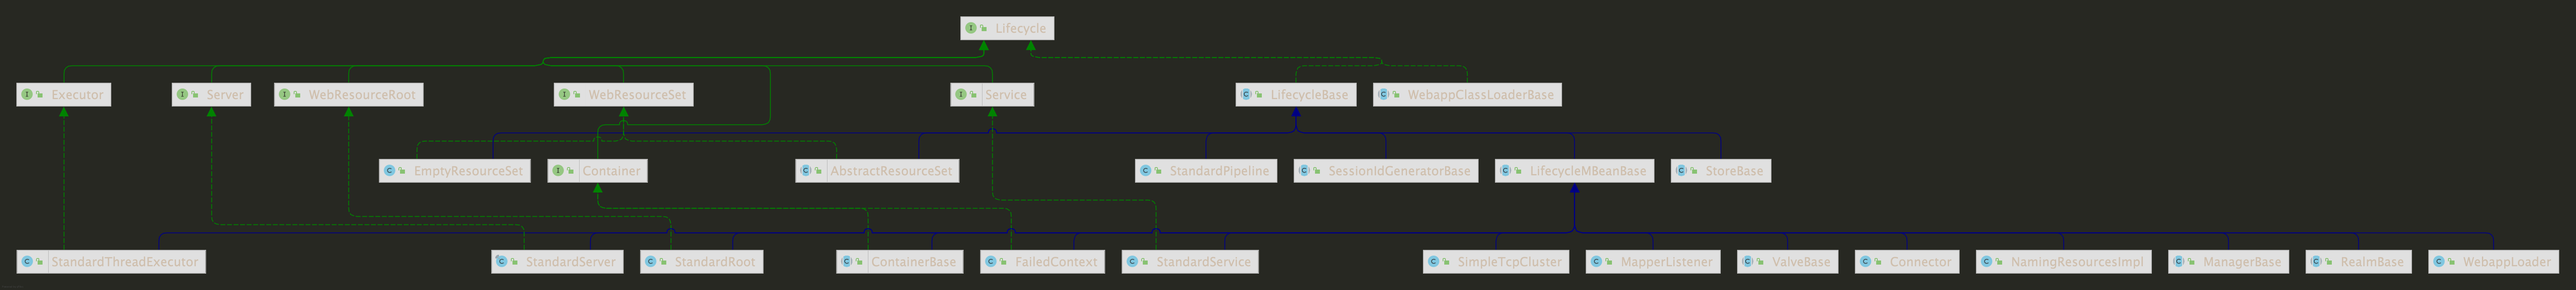
Base implementation of the {@link Lifecycle} interface that implements the state transition rules for {@link Lifecycle#start()} and {@link Lifecycle#stop()}
if (log.isDebugEnabled()) { log.debug(sm.getString("lifecycleBase.setState", this, state)); }
if (check) { // Must have been triggered by one of the abstract methods (assume // code in this class is correct) // null is never a valid state if (state == null) { invalidTransition("null"); // Unreachable code - here to stop eclipse complaining about // a possible NPE further down the method return; }
// Any method can transition to failed // startInternal() permits STARTING_PREP to STARTING // stopInternal() permits STOPPING_PREP to STOPPING and FAILED to // STOPPING if (!(state == LifecycleState.FAILED || (this.state == LifecycleState.STARTING_PREP && state == LifecycleState.STARTING) || (this.state == LifecycleState.STOPPING_PREP && state == LifecycleState.STOPPING) || (this.state == LifecycleState.FAILED && state == LifecycleState.STOPPING))) { // No other transition permitted invalidTransition(state.name()); } }
/** * @return the domain under which this component will be / has been * registered. */ String getDomain();
/** * Specify the domain under which this component should be registered. Used * with components that cannot (easily) navigate the component hierarchy to * determine the correct domain to use. * * @param domain The name of the domain under which this component should be * registered */ voidsetDomain(String domain);
/** * @return the name under which this component has been registered with JMX. */ ObjectName getObjectName(); }
// org.apache.catalina.util.LifecycleMBeanBase#initInternal /** * Sub-classes wishing to perform additional initialization should override * this method, ensuring that super.initInternal() is the first call in the * overriding method. */ @Override protectedvoidinitInternal()throws LifecycleException {
// If oname is not null then registration has already happened via // preRegister(). if (oname == null) { mserver = Registry.getRegistry(null, null).getMBeanServer();
// org.apache.catalina.util.LifecycleMBeanBase#destroyInternal /** * Sub-classes wishing to perform additional clean-up should override this * method, ensuring that super.destroyInternal() is the last call in the * overriding method. */ @Override protectedvoiddestroyInternal()throws LifecycleException { unregister(oname); }
// Construct an object name with the right domain StringBuilder name = new StringBuilder(getDomain()); name.append(':'); name.append(objectNameKeyProperties);
# Licensed to the Apache Software Foundation (ASF) under one or more # contributor license agreements. See the NOTICE file distributed with # this work for additional information regarding copyright ownership. # The ASF licenses this file to You under the Apache License, Version 2.0 # (the "License"); you may not use this file except in compliance with # the License. You may obtain a copy of the License at # # http://www.apache.org/licenses/LICENSE-2.0 # # Unless required by applicable law or agreed to in writing, software # distributed under the License is distributed on an "AS IS" BASIS, # WITHOUT WARRANTIES OR CONDITIONS OF ANY KIND, either express or implied. # See the License for the specific language governing permissions and # limitations under the License.
# ----------------------------------------------------------------------------- # Start Script for the CATALINA Server # -----------------------------------------------------------------------------
while [ -h "$PRG" ] ; do ls=`ls -ld "$PRG"` link=`expr "$ls" : '.*-> \(.*\)$'` if expr "$link" : '/.*' > /dev/null; then PRG="$link" else PRG=`dirname "$PRG"`/"$link" fi done
PRGDIR=`dirname "$PRG"` EXECUTABLE=catalina.sh
# Check that target executable exists if$os400; then # -x will Only work on the os400 if the files are: # 1. owned by the user # 2. owned by the PRIMARY group of the user # this will not work if the user belongs in secondary groups eval else if [ ! -x "$PRGDIR"/"$EXECUTABLE" ]; then echo"Cannot find $PRGDIR/$EXECUTABLE" echo"The file is absent or does not have execute permission" echo"This file is needed to run this program" exit 1 fi fi
➜ bin catalina.sh Using CATALINA_BASE: /Users/qishengli/software/apache-tomcat-8.5.32 Using CATALINA_HOME: /Users/qishengli/software/apache-tomcat-8.5.32 Using CATALINA_TMPDIR: /Users/qishengli/software/apache-tomcat-8.5.32/temp Using JRE_HOME: /Users/qishengli/software/jdk8/jre Using CLASSPATH: /Users/qishengli/software/apache-tomcat-8.5.32/bin/bootstrap.jar:/Users/qishengli/software/apache-tomcat-8.5.32/bin/tomcat-juli.jar Usage: catalina.sh ( commands ... ) commands: debug Start Catalina in a debugger debug -security Debug Catalina with a security manager jpda start Start Catalina under JPDA debugger run Start Catalina in the current window run -security Start in the current window with security manager start Start Catalina in a separate window start -security Start in a separate window with security manager stop Stop Catalina, waiting up to 5 seconds for the process to end stop n Stop Catalina, waiting up to n seconds for the process to end stop -force Stop Catalina, wait up to 5 seconds and then use kill -KILL if still running stop n -force Stop Catalina, wait up to n seconds and then use kill -KILL if still running configtest Run a basic syntax check on server.xml - check exit code for result version What version of tomcat are you running? Note: Waiting for the process to end and use of the -force option require that $CATALINA_PID is defined
比如version:
1 2 3 4 5 6 7 8 9 10 11 12 13 14
➜ bin catalina.sh version Using CATALINA_BASE: /Users/qishengli/software/apache-tomcat-8.5.32 Using CATALINA_HOME: /Users/qishengli/software/apache-tomcat-8.5.32 Using CATALINA_TMPDIR: /Users/qishengli/software/apache-tomcat-8.5.32/temp Using JRE_HOME: /Users/qishengli/software/jdk8/jre Using CLASSPATH: /Users/qishengli/software/apache-tomcat-8.5.32/bin/bootstrap.jar:/Users/qishengli/software/apache-tomcat-8.5.32/bin/tomcat-juli.jar Server version: Apache Tomcat/8.5.32 Server built: Jun 20 2018 19:50:35 UTC Server number: 8.5.32.0 OS Name: Mac OS X OS Version: 11.6 Architecture: aarch64 JVM Version: 1.8.0_282-b08 JVM Vendor: Azul Systems, Inc.
➜ bin cat setenv.sh export CATALINA_OPTS="-agentpath:/Users/qishengli/Downloads/async-profiler-2.5-macos/build/libasyncProfiler.so=start,event=cpu,interval=1ms,file=profile.html -Djava.rmi.server.logCalls=true -Dsun.rmi.server.logLevel=debug"
对应的脚本位置:
1 2 3 4 5 6 7
➜ bin grep -n setenv catalina.sh 24:# setenv.sh in CATALINA_BASE/bin to keep your customizations separate. 145:# but allow them to be specified in setenv.sh, in rare case when it is needed. 148:if [ -r "$CATALINA_BASE/bin/setenv.sh" ]; then 149: . "$CATALINA_BASE/bin/setenv.sh" 150:elif [ -r "$CATALINA_HOME/bin/setenv.sh" ]; then 151: . "$CATALINA_HOME/bin/setenv.sh"
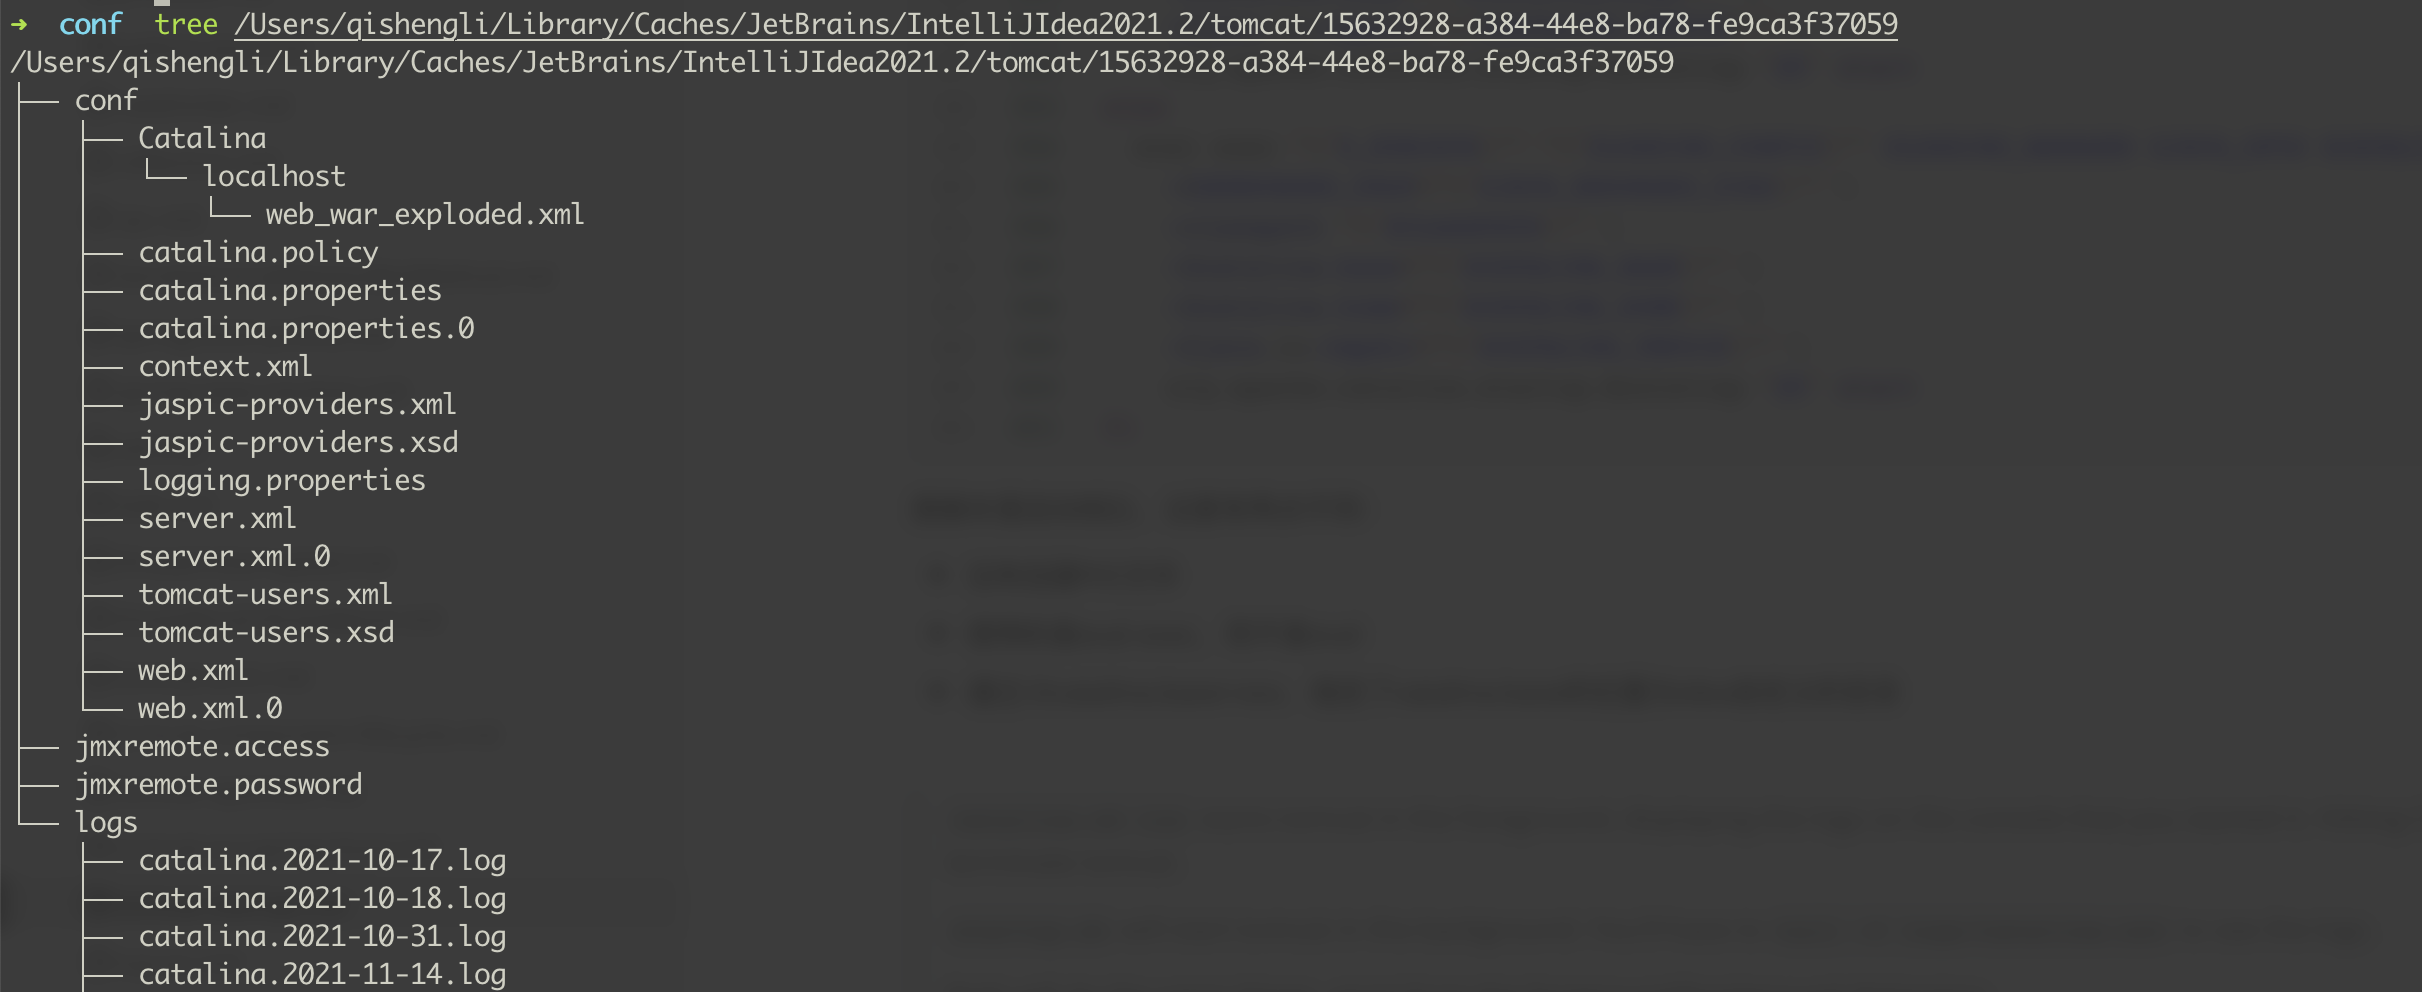
/Users/qishengli/software/apache-tomcat-8.5.32/bin/catalina.sh run NOTE: Picked up JDK_JAVA_OPTIONS: --add-opens=java.base/java.lang=ALL-UNNAMED --add-opens=java.base/java.io=ALL-UNNAMED --add-opens=java.rmi/sun.rmi.transport=ALL-UNNAMED -Dcatalina.base=/Users/qishengli/Library/Caches/JetBrains/IntelliJIdea2021.2/tomcat/15632928-a384-44e8-ba78-fe9ca3f37059 [2021-10-31 05:19:05,458] Artifact web:war exploded: Waiting for server connection to start artifact deployment...
catalina.sh run starts tomcat in the foreground, displaying the logs on the console that you started it. Hitting Ctrl-C will terminate tomcat.
startup.sh will start tomcat in the background. You’ll have to tail -f logs/catalina.out to see the logs.
Both will do the same things, apart from the foreground/background distinction.
后续的流程就到了java代码里
Java代码中的启动流程
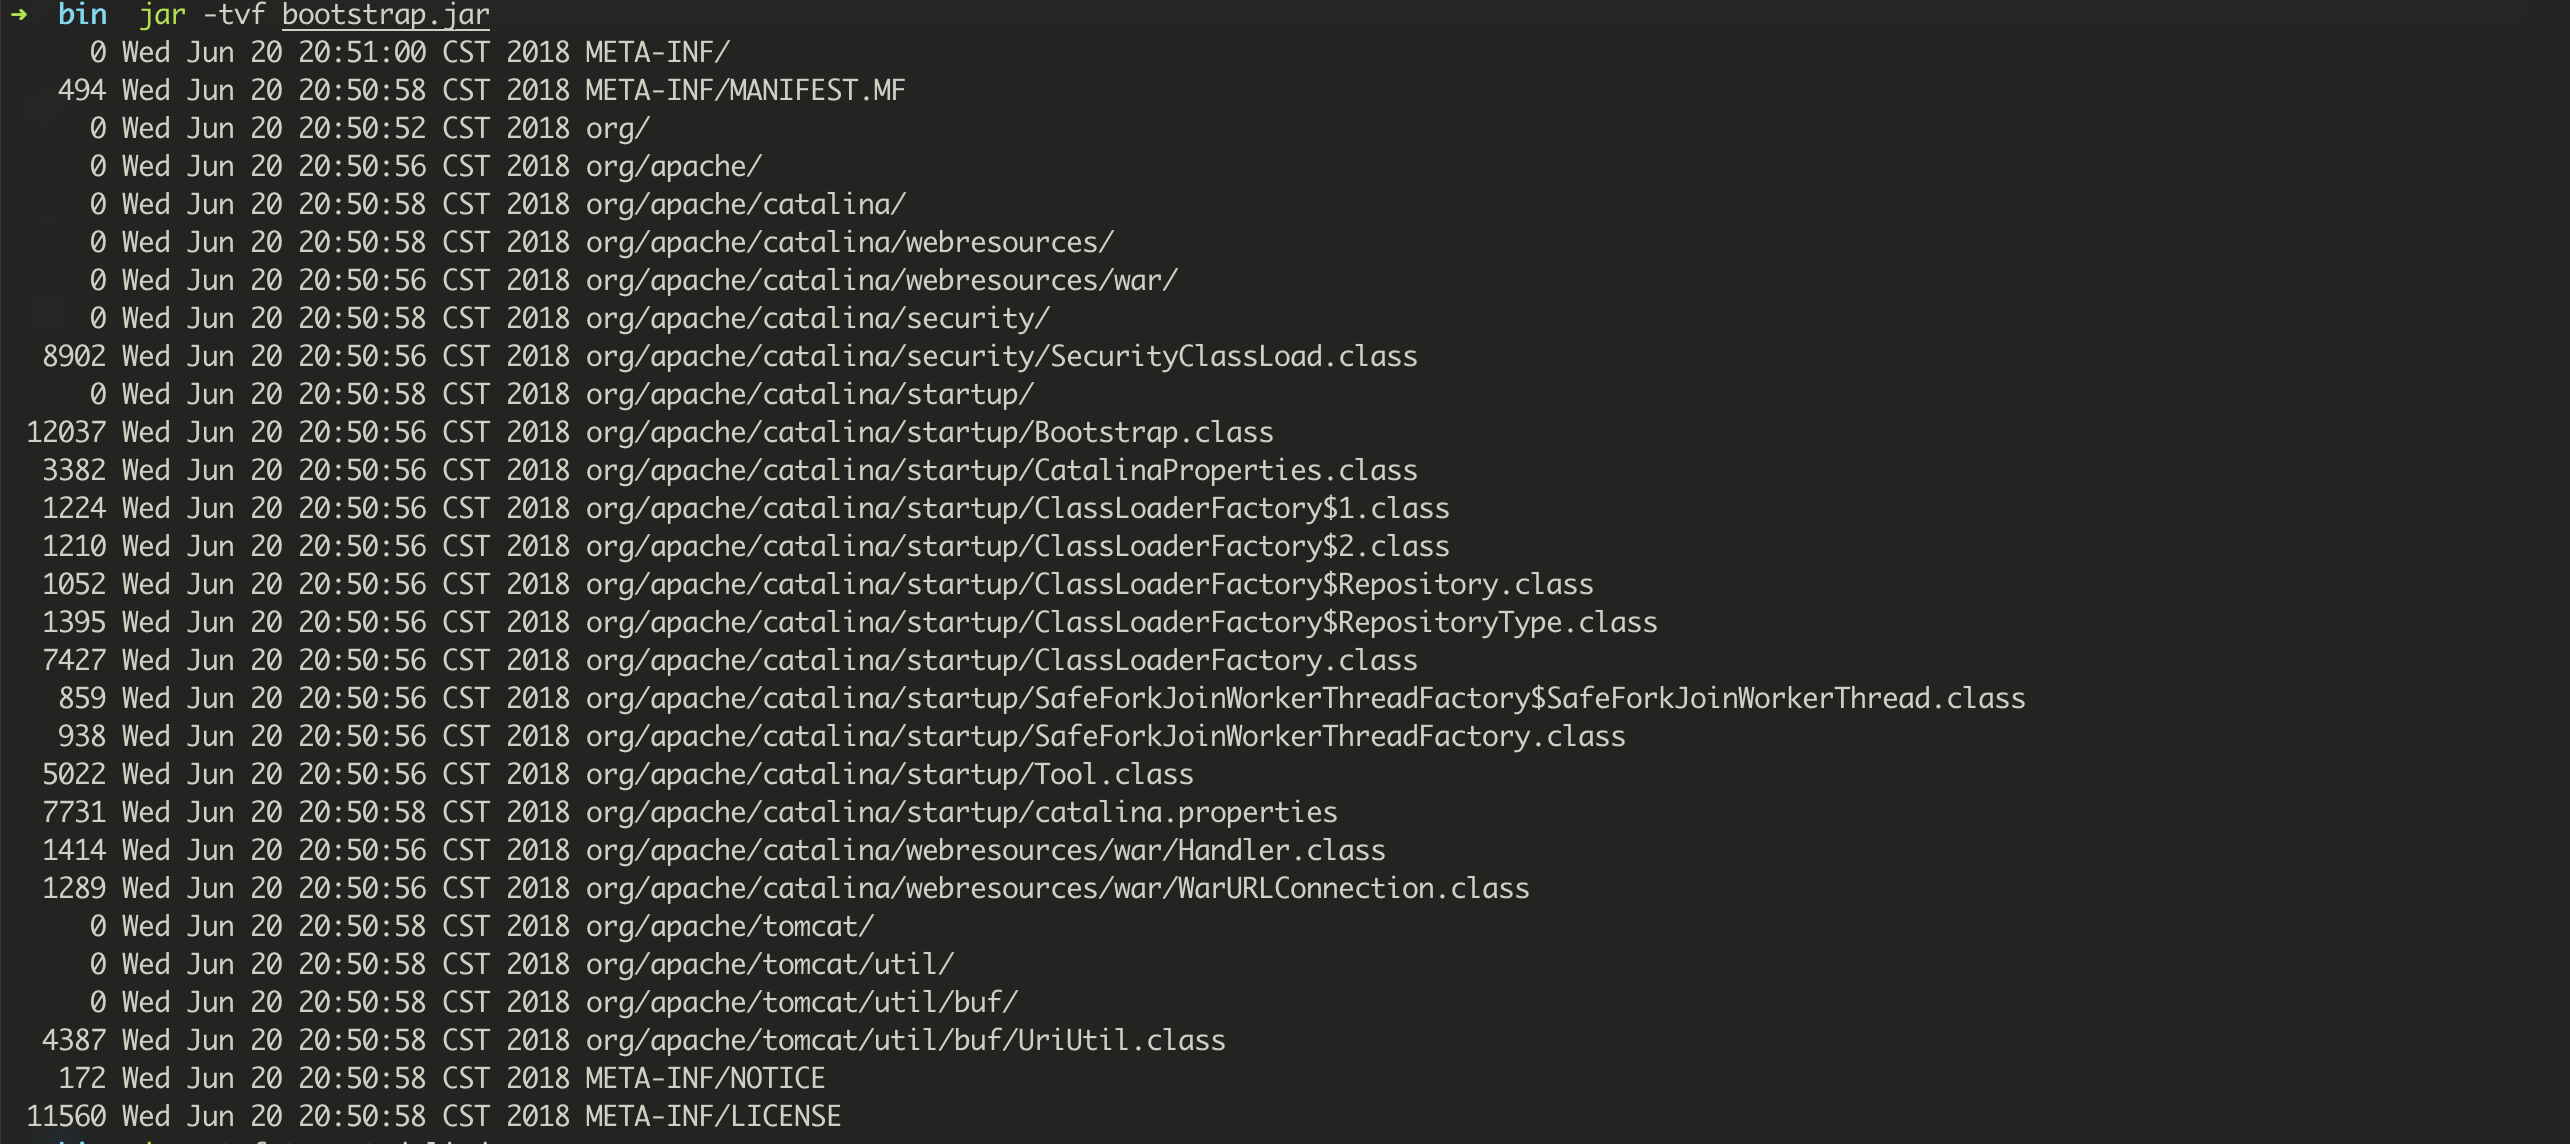
Bootstrap
The purpose of this roundabout approach is to keep the Catalina internal classes (and any other classes they depend on, such as an XML parser) out of the system class path and therefore not visible to application level classes.
38 # List of comma-separated paths defining the contents of the "common" 39 # classloader. 53 common.loader="${catalina.base}/lib","${catalina.base}/lib/*.jar","${catalina.home}/lib","${catalina.home}/lib/*.jar"
56 # List of comma-separated paths defining the contents of the "server" 57 # classloader. 71 server.loader=
73 # 74 # List of comma-separated paths defining the contents of the "shared" 75 # classloader. 90 shared.loader=
"javaee connector"#5620 prio=4 os_prio=31 cpu=17.64ms elapsed=926.91s tid=0x000000036be2e400 nid=0x4e78b runnable [0x000000039bbb9000] java.lang.Thread.State: RUNNABLE at java.net.SocketInputStream.socketRead0(java.base@11.0.12/Native Method) at java.net.SocketInputStream.socketRead(java.base@11.0.12/SocketInputStream.java:115) at java.net.SocketInputStream.read(java.base@11.0.12/SocketInputStream.java:168) at java.net.SocketInputStream.read(java.base@11.0.12/SocketInputStream.java:140) at java.io.BufferedInputStream.fill(java.base@11.0.12/BufferedInputStream.java:252) at java.io.BufferedInputStream.read(java.base@11.0.12/BufferedInputStream.java:271) - locked <0x0000000794f63408> (a java.io.BufferedInputStream) at java.io.DataInputStream.readByte(java.base@11.0.12/DataInputStream.java:270) at sun.rmi.transport.StreamRemoteCall.executeCall(java.rmi@11.0.12/StreamRemoteCall.java:240) at sun.rmi.server.UnicastRef.invoke(java.rmi@11.0.12/UnicastRef.java:164) at jdk.jmx.remote.internal.rmi.PRef.invoke(jdk.remoteref/Unknown Source) at javax.management.remote.rmi.RMIConnectionImpl_Stub.invoke(java.management.rmi@11.0.12/Unknown Source) at javax.management.remote.rmi.RMIConnector$RemoteMBeanServerConnection.invoke(java.management.rmi@11.0.12/RMIConnector.java:1021) at com.intellij.javaee.oss.util.AbstractConnectorCommand.invokeOperation(AbstractConnectorCommand.java:139) at org.jetbrains.idea.tomcat.admin.TomcatAdminServerBase$2.doExecute(TomcatAdminServerBase.java:159) at org.jetbrains.idea.tomcat.admin.TomcatAdminServerBase$2.doExecute(TomcatAdminServerBase.java:155) at com.intellij.javaee.oss.util.AbstractConnectorCommand$1.call(AbstractConnectorCommand.java:36) at java.util.concurrent.FutureTask.run(java.base@11.0.12/FutureTask.java:264) at java.util.concurrent.ThreadPoolExecutor.runWorker(java.base@11.0.12/ThreadPoolExecutor.java:1128) at java.util.concurrent.ThreadPoolExecutor$Worker.run(java.base@11.0.12/ThreadPoolExecutor.java:628) at java.lang.Thread.run(java.base@11.0.12/Thread.java:829)
/* * Decompiled with CFR. * * Could not load the following classes: * org.jetbrains.idea.tomcat.admin.TomcatJmxAdminServerBase * org.jetbrains.idea.tomcat.admin.TomcatJmxAdminServerBase$TomcatConnectorCommandBase */ package org.jetbrains.idea.tomcat.admin;
Servlets are initialized either lazily at request processing time or eagerly during deployment. In the latter case, they are initialized in the order indicated by their load-on-startup elements.
在web容器启动的时候,可以采用lazily加载的方式和eagerly的方式。
load-on-startup中的值决定了进行哪种方式。
If the value is a negative integer, or the element is not present, the container is free to load the servlet whenever it chooses. If the value is a positive integer or 0, the container must load and initialize the servlet as the application is deployed.
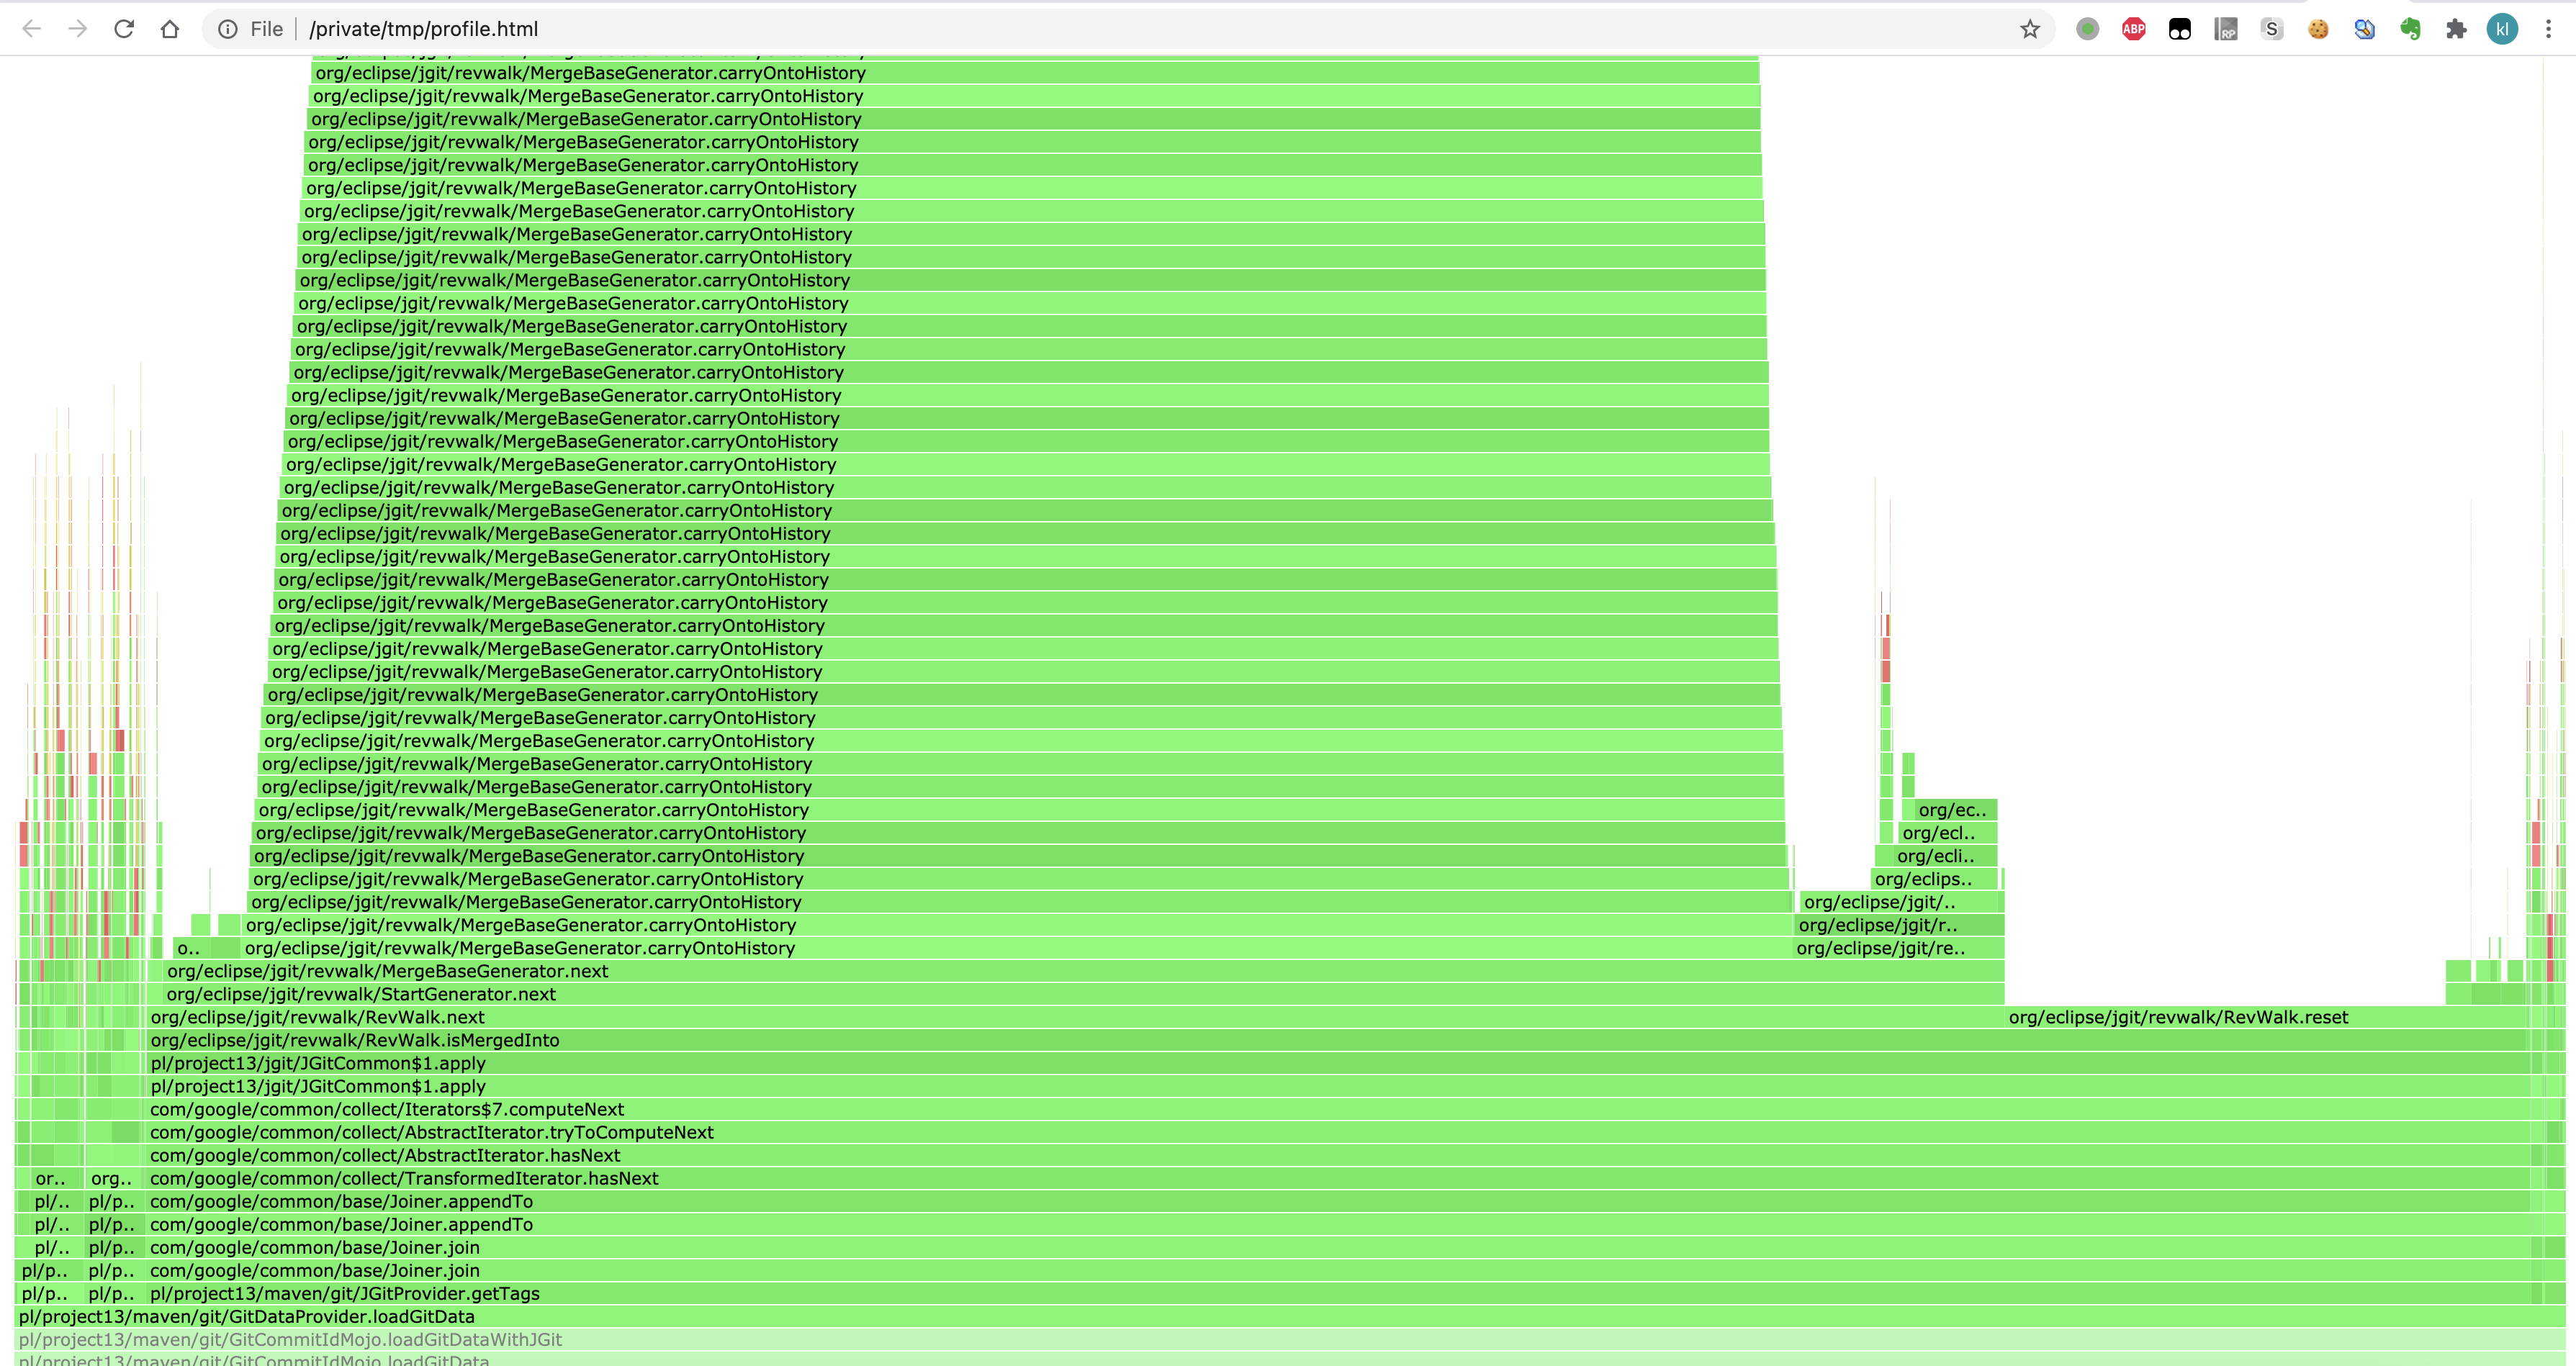
using the native git binary should usually give your build some performance boost, it may randomly break if you upgrade your git version and it decides to print information in a different format suddenly. As rule of thumb, keep using the default jgit implementation until you notice performance problems within your build
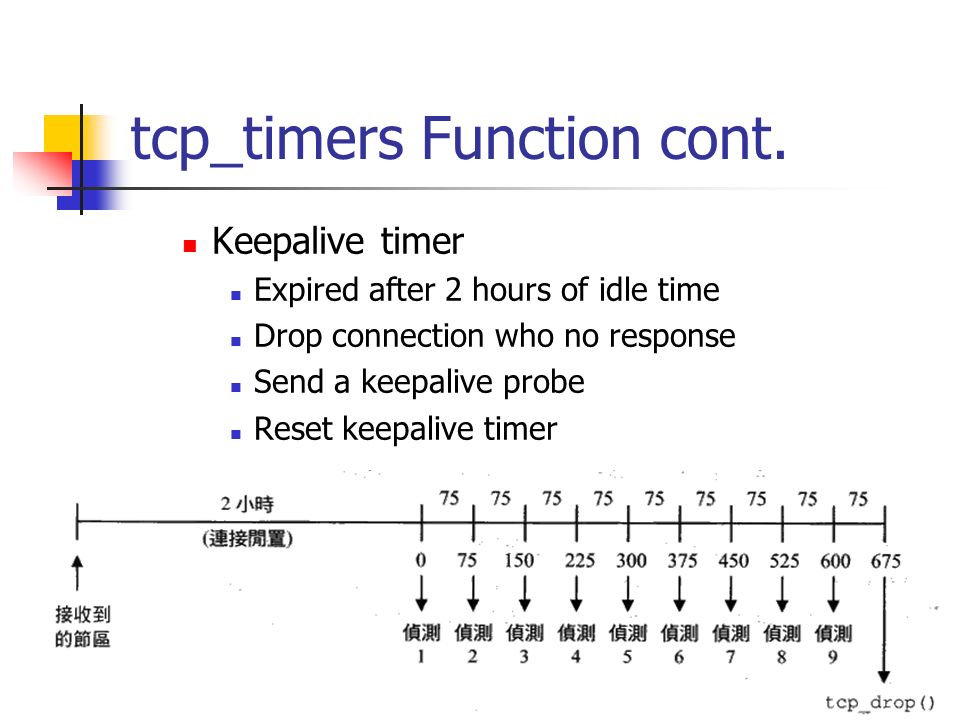
the interval between the last data packet sent (simple ACKs are not considered data) and the first keepalive probe; after the connection is marked to need keepalive, this counter is not used any further
连接空闲tcp_keepalive_time这么久之后,系统协议栈会认为连接需要保活
tcp_keepalive_intvl
the interval between subsequential keepalive probes, regardless of what the connection has exchanged in the meantime
两次探测的间隔
tcp_keepalive_probes
the number of unacknowledged probes to send before considering the connection dead and notifying the application layer
A comma-separated list of parameters, each consisting of an identifier and a value separated by the equal sign ('='). The following identifiers are possible:
timeout: indicating the minimum amount of time an idle connection has to be kept opened (in seconds). Note that timeouts longer than the TCP timeout may be ignored if no keep-alive TCP message is set at the transport level.
max: indicating the maximum number of requests that can be sent on this connection before closing it. Unless 0, this value is ignored for non-pipelined connections as another request will be sent in the next response. An HTTP pipeline can use it to limit the pipelining.
The *connections* parameter sets the maximum number of idle keepalive connections to upstream servers that are preserved in the cache of each worker process. When this number is exceeded, the least recently used connections are closed.
类似maxIdle
Tomcat
配置名称
备注
keepAliveTimeout
The number of milliseconds this Connector will wait for another HTTP request before closing the connection. The default value is to use the value that has been set for the connectionTimeout attribute. Use a value of -1 to indicate no (i.e. infinite) timeout.
maxKeepAliveRequests
The maximum number of HTTP requests which can be pipelined until the connection is closed by the server. Setting this attribute to 1 will disable HTTP/1.0 keep-alive, as well as HTTP/1.1 keep-alive and pipelining. Setting this to -1 will allow an unlimited amount of pipelined or keep-alive HTTP requests. If not specified, this attribute is set to 100.
/** * Closes connections that have been idle longer than the given period * of time and evicts them from the pool. * * @param idletime maximum idle time. * @param tunit time unit. */ // org.apache.http.pool.AbstractConnPool#closeIdle publicvoidcloseIdle(finallong idletime, final TimeUnit tunit){ Args.notNull(tunit, "Time unit"); long time = tunit.toMillis(idletime); if (time < 0) { time = 0; } finallong deadline = System.currentTimeMillis() - time; enumAvailable(new PoolEntryCallback<T, C>() {
/** * Closes expired connections and evicts them from the pool. */ // org.apache.http.pool.AbstractConnPool#closeExpired publicvoidcloseExpired(){ finallong now = System.currentTimeMillis(); enumAvailable(new PoolEntryCallback<T, C>() {
// org.apache.http.impl.execchain.MinimalClientExec#execute // The connection is in or can be brought to a re-usable state. if (reuseStrategy.keepAlive(response, context)) { // Set the idle duration of this connection finallong duration = keepAliveStrategy.getKeepAliveDuration(response, context); // 连接有效期 releaseTrigger.setValidFor(duration, TimeUnit.MILLISECONDS); // 标记为可以复用 releaseTrigger.markReusable(); } else { releaseTrigger.markNonReusable(); }
// org.apache.http.impl.conn.PoolingHttpClientConnectionManager#releaseConnection publicvoidreleaseConnection( final HttpClientConnection managedConn, final Object state, finallong keepalive, final TimeUnit tunit){ Args.notNull(managedConn, "Managed connection"); synchronized (managedConn) { final CPoolEntry entry = CPoolProxy.detach(managedConn); if (entry == null) { return; } final ManagedHttpClientConnection conn = entry.getConnection(); try { if (conn.isOpen()) { entry.setState(state); // 设置对象的过期时间 entry.updateExpiry(keepalive, tunit != null ? tunit : TimeUnit.MILLISECONDS); // debug 日志 if (this.log.isDebugEnabled()) { final String s; if (keepalive > 0) { s = "for " + (double) keepalive / 1000 + " seconds"; } else { s = "indefinitely"; } this.log.debug("Connection " + format(entry) + " can be kept alive " + s); } } } finally { this.pool.release(entry, conn.isOpen() && entry.isRouteComplete()); if (this.log.isDebugEnabled()) { this.log.debug("Connection released: " + format(entry) + formatStats(entry.getRoute())); } } } }
/** * Returns the duration of time which this connection can be safely kept * idle. If the connection is left idle for longer than this period of time, * it MUST not reused. A value of 0 or less may be returned to indicate that * there is no suitable suggestion. * * When coupled with a {@link org.apache.http.ConnectionReuseStrategy}, if * {@link org.apache.http.ConnectionReuseStrategy#keepAlive( * HttpResponse, HttpContext)} returns true, this allows you to control * how long the reuse will last. If keepAlive returns false, this should * have no meaningful impact * * @param response * The last response received over the connection. * @param context * the context in which the connection is being used. * * @return the duration in ms for which it is safe to keep the connection * idle, or <=0 if no suggested duration. */ longgetKeepAliveDuration(HttpResponse response, HttpContext context);
/** * Decides whether a connection can be kept open after a request. * If this method returns <code>false</code>, the caller MUST * close the connection to correctly comply with the HTTP protocol. * If it returns <code>true</code>, the caller SHOULD attempt to * keep the connection open for reuse with another request. * <br/> * One can use the HTTP context to retrieve additional objects that * may be relevant for the keep-alive strategy: the actual HTTP * connection, the original HTTP request, target host if known, * number of times the connection has been reused already and so on. * <br/> * If the connection is already closed, <code>false</code> is returned. * The stale connection check MUST NOT be triggered by a * connection reuse strategy. * * @param response * The last response received over that connection. * @param context the context in which the connection is being * used. * * @return <code>true</code> if the connection is allowed to be reused, or * <code>false</code> if it MUST NOT be reused */ booleankeepAlive(HttpResponse response, HttpContext context);
// org.apache.http.impl.DefaultConnectionReuseStrategy // see interface ConnectionReuseStrategy publicbooleankeepAlive(final HttpResponse response, final HttpContext context){ Args.notNull(response, "HTTP response"); Args.notNull(context, "HTTP context");
// Check for a self-terminating entity. If the end of the entity will // be indicated by closing the connection, there is no keep-alive. final ProtocolVersion ver = response.getStatusLine().getProtocolVersion(); final Header teh = response.getFirstHeader(HTTP.TRANSFER_ENCODING); if (teh != null) { // 有Transfer-Encoding,但是值不是chunked的,不可复用 // 看上面的注释是因为,有些encoding会以连接关闭来标识entity结束 if (!HTTP.CHUNK_CODING.equalsIgnoreCase(teh.getValue())) { returnfalse; } } else { // 有response body,但是content-length不合法的也应该关闭 // 这是RFC中规定的 if (canResponseHaveBody(response)) { final Header[] clhs = response.getHeaders(HTTP.CONTENT_LEN); // Do not reuse if not properly content-length delimited if (clhs.length == 1) { final Header clh = clhs[0]; try { finalint contentLen = Integer.parseInt(clh.getValue()); if (contentLen < 0) { returnfalse; } } catch (final NumberFormatException ex) { returnfalse; } } else { returnfalse; } } }
// Check for the "Connection" header. If that is absent, check for // the "Proxy-Connection" header. The latter is an unspecified and // broken but unfortunately common extension of HTTP. // header中的Connection HeaderIterator hit = response.headerIterator(HTTP.CONN_DIRECTIVE); if (!hit.hasNext()) { hit = response.headerIterator("Proxy-Connection"); }
// Experimental usage of the "Connection" header in HTTP/1.0 is // documented in RFC 2068, section 19.7.1. A token "keep-alive" is // used to indicate that the connection should be persistent. // Note that the final specification of HTTP/1.1 in RFC 2616 does not // include this information. Neither is the "Connection" header // mentioned in RFC 1945, which informally describes HTTP/1.0. // // RFC 2616 specifies "close" as the only connection token with a // specific meaning: it disables persistent connections. // // The "Proxy-Connection" header is not formally specified anywhere, // but is commonly used to carry one token, "close" or "keep-alive". // The "Connection" header, on the other hand, is defined as a // sequence of tokens, where each token is a header name, and the // token "close" has the above-mentioned additional meaning. // // To get through this mess, we treat the "Proxy-Connection" header // in exactly the same way as the "Connection" header, but only if // the latter is missing. We scan the sequence of tokens for both // "close" and "keep-alive". As "close" is specified by RFC 2068, // it takes precedence and indicates a non-persistent connection. // If there is no "close" but a "keep-alive", we take the hint.
if (hit.hasNext()) { try { final TokenIterator ti = createTokenIterator(hit); boolean keepalive = false; while (ti.hasNext()) { final String token = ti.nextToken(); if (HTTP.CONN_CLOSE.equalsIgnoreCase(token)) { // 如果是Connection: close,是不能复用的 returnfalse; } elseif (HTTP.CONN_KEEP_ALIVE.equalsIgnoreCase(token)) { // continue the loop, there may be a "close" afterwards // Connection: Keep-Alive keepalive = true; } } if (keepalive) { returntrue; // neither "close" nor "keep-alive", use default policy }
} catch (final ParseException px) { // invalid connection header means no persistent connection // we don't have logging in HttpCore, so the exception is lost returnfalse; } }
// HTTP/1.1之后,默认都是可以keepalive的 // default since HTTP/1.1 is persistent, before it was non-persistent return !ver.lessEquals(HttpVersion.HTTP_1_0); }
⏳keepaliveTime This property controls how frequently HikariCP will attempt to keep a connection alive, in order to prevent it from being timed out by the database or network infrastructure. This value must be less than the maxLifetime value. A “keepalive” will only occur on an idle connection. When the time arrives for a “keepalive” against a given connection, that connection will be removed from the pool, “pinged”, and then returned to the pool. The ‘ping’ is one of either: invocation of the JDBC4 isValid() method, or execution of the connectionTestQuery. Typically, the duration out-of-the-pool should be measured in single digit milliseconds or even sub-millisecond, and therefore should have little or no noticible performance impact. The minimum allowed value is 30000ms (30 seconds), but a value in the range of minutes is most desirable. Default: 0 (disabled)
⏳idleTimeout This property controls the maximum amount of time that a connection is allowed to sit idle in the pool. This setting only applies when minimumIdle is defined to be less than maximumPoolSize. Idle connections will not be retired once the pool reaches minimumIdle connections. Whether a connection is retired as idle or not is subject to a maximum variation of +30 seconds, and average variation of +15 seconds. A connection will never be retired as idle before this timeout. A value of 0 means that idle connections are never removed from the pool. The minimum allowed value is 10000ms (10 seconds). Default: 600000 (10 minutes)
@Test @SneakyThrows publicvoidtestTransaction(){ try (Connection conn = DriverManager.getConnection(connectString)) { conn.setAutoCommit(false); try (PreparedStatement psts = conn.prepareStatement("update words set word=CONCAT(word, '++') where id=?")) { // 第一个更新语句 psts.setInt(1, 2); psts.executeUpdate(); // 第二个更新语句 // 抛出异常 int i = 1/0; psts.setInt(1, 3); psts.executeUpdate(); // 提交事务 conn.commit(); } catch (Throwable t) { conn.rollback(); }
} }
结果:
1 2 3 4 5 6 7 8
2021-03-23T03:07:15.228849Z 93 Connectroot@localhost on test using TCP/IP 2021-03-23T03:07:15.235215Z 93 Query/* mysql-connector-java-8.0.20 (Revision: afc0a13cd3c5a0bf57eaa809ee0ee6df1fd5ac9b) */SELECT @@session.auto_increment_increment AS auto_increment_increment, @@character_set_client AS character_set_client, @@character_set_connection AS character_set_connection, @@character_set_results AS character_set_results, @@character_set_server AS character_set_server, @@collation_server AS collation_server, @@collation_connection AS collation_connection, @@init_connect AS init_connect, @@interactive_timeout AS interactive_timeout, @@license AS license, @@lower_case_table_names AS lower_case_table_names, @@max_allowed_packet AS max_allowed_packet, @@net_write_timeout AS net_write_timeout, @@performance_schema AS performance_schema, @@sql_mode AS sql_mode, @@system_time_zone AS system_time_zone, @@time_zone AS time_zone, @@transaction_isolation AS transaction_isolation, @@wait_timeout AS wait_timeout 2021-03-23T03:07:15.257727Z 93 QuerySET character_set_results = NULL 2021-03-23T03:07:15.261596Z 93 QuerySET autocommit=0 2021-03-23T03:07:15.296076Z 93 Queryupdate words set word=CONCAT(word, '++') where id=2 2021-03-23T03:07:15.305666Z 93 Queryrollback 2021-03-23T03:07:15.330138Z 93 Queryrollback 2021-03-23T03:07:15.347768Z 93 Quit
This is the central interface in Spring’s transaction infrastructure. Applications can use this directly, but it is not primarily meant as API: Typically, applications will work with either TransactionTemplate or declarative transaction demarcation through AOP.
/** * Return a currently active transaction or create a new one, according to * the specified propagation behavior. * <p>Note that parameters like isolation level or timeout will only be applied * to new transactions, and thus be ignored when participating in active ones. * <p>Furthermore, not all transaction definition settings will be supported * by every transaction manager: A proper transaction manager implementation * should throw an exception when unsupported settings are encountered. * <p>An exception to the above rule is the read-only flag, which should be * ignored if no explicit read-only mode is supported. Essentially, the * read-only flag is just a hint for potential optimization. * @param definition TransactionDefinition instance (can be {@code null} for defaults), * describing propagation behavior, isolation level, timeout etc. * @return transaction status object representing the new or current transaction * @throws TransactionException in case of lookup, creation, or system errors * @throws IllegalTransactionStateException if the given transaction definition * cannot be executed (for example, if a currently active transaction is in * conflict with the specified propagation behavior) * @see TransactionDefinition#getPropagationBehavior * @see TransactionDefinition#getIsolationLevel * @see TransactionDefinition#getTimeout * @see TransactionDefinition#isReadOnly */ TransactionStatus getTransaction(TransactionDefinition definition)throws TransactionException;
/** * Commit the given transaction, with regard to its status. If the transaction * has been marked rollback-only programmatically, perform a rollback. * <p>If the transaction wasn't a new one, omit the commit for proper * participation in the surrounding transaction. If a previous transaction * has been suspended to be able to create a new one, resume the previous * transaction after committing the new one. * <p>Note that when the commit call completes, no matter if normally or * throwing an exception, the transaction must be fully completed and * cleaned up. No rollback call should be expected in such a case. * <p>If this method throws an exception other than a TransactionException, * then some before-commit error caused the commit attempt to fail. For * example, an O/R Mapping tool might have tried to flush changes to the * database right before commit, with the resulting DataAccessException * causing the transaction to fail. The original exception will be * propagated to the caller of this commit method in such a case. * @param status object returned by the {@code getTransaction} method * @throws UnexpectedRollbackException in case of an unexpected rollback * that the transaction coordinator initiated * @throws HeuristicCompletionException in case of a transaction failure * caused by a heuristic decision on the side of the transaction coordinator * @throws TransactionSystemException in case of commit or system errors * (typically caused by fundamental resource failures) * @throws IllegalTransactionStateException if the given transaction * is already completed (that is, committed or rolled back) * @see TransactionStatus#setRollbackOnly */ voidcommit(TransactionStatus status)throws TransactionException;
/** * Perform a rollback of the given transaction. * <p>If the transaction wasn't a new one, just set it rollback-only for proper * participation in the surrounding transaction. If a previous transaction * has been suspended to be able to create a new one, resume the previous * transaction after rolling back the new one. * <p><b>Do not call rollback on a transaction if commit threw an exception.</b> * The transaction will already have been completed and cleaned up when commit * returns, even in case of a commit exception. Consequently, a rollback call * after commit failure will lead to an IllegalTransactionStateException. * @param status object returned by the {@code getTransaction} method * @throws TransactionSystemException in case of rollback or system errors * (typically caused by fundamental resource failures) * @throws IllegalTransactionStateException if the given transaction * is already completed (that is, committed or rolled back) */ voidrollback(TransactionStatus status)throws TransactionException;
// org.springframework.transaction.support.AbstractPlatformTransactionManager#commit /** * This implementation of commit handles participating in existing * transactions and programmatic rollback requests. * Delegates to {@code isRollbackOnly}, {@code doCommit} * and {@code rollback}. * @see org.springframework.transaction.TransactionStatus#isRollbackOnly() * @see #doCommit * @see #rollback */ @Override publicfinalvoidcommit(TransactionStatus status)throws TransactionException { if (status.isCompleted()) { thrownew IllegalTransactionStateException( "Transaction is already completed - do not call commit or rollback more than once per transaction"); }
DefaultTransactionStatus defStatus = (DefaultTransactionStatus) status; if (defStatus.isLocalRollbackOnly()) { if (defStatus.isDebug()) { logger.debug("Transactional code has requested rollback"); } processRollback(defStatus); return; } if (!shouldCommitOnGlobalRollbackOnly() && defStatus.isGlobalRollbackOnly()) { if (defStatus.isDebug()) { logger.debug("Global transaction is marked as rollback-only but transactional code requested commit"); } processRollback(defStatus); // Throw UnexpectedRollbackException only at outermost transaction boundary // or if explicitly asked to. if (status.isNewTransaction() || isFailEarlyOnGlobalRollbackOnly()) { thrownew UnexpectedRollbackException( "Transaction rolled back because it has been marked as rollback-only"); } return; }
processCommit(defStatus); }
// org.springframework.transaction.support.AbstractPlatformTransactionManager#processCommit /** * Process an actual commit. * Rollback-only flags have already been checked and applied. * @param status object representing the transaction * @throws TransactionException in case of commit failure */ privatevoidprocessCommit(DefaultTransactionStatus status)throws TransactionException { try { boolean beforeCompletionInvoked = false; try { prepareForCommit(status); // 下面的几个方法会通知之前注册的TransactionSynchronization,告知事务的状态 triggerBeforeCommit(status); triggerBeforeCompletion(status); beforeCompletionInvoked = true; boolean globalRollbackOnly = false; if (status.isNewTransaction() || isFailEarlyOnGlobalRollbackOnly()) { globalRollbackOnly = status.isGlobalRollbackOnly(); } if (status.hasSavepoint()) { if (status.isDebug()) { logger.debug("Releasing transaction savepoint"); } status.releaseHeldSavepoint(); } elseif (status.isNewTransaction()) { if (status.isDebug()) { logger.debug("Initiating transaction commit"); } // template method // 子类负责实现 doCommit(status); } // Throw UnexpectedRollbackException if we have a global rollback-only // marker but still didn't get a corresponding exception from commit. if (globalRollbackOnly) { thrownew UnexpectedRollbackException( "Transaction silently rolled back because it has been marked as rollback-only"); } } catch (UnexpectedRollbackException ex) { // can only be caused by doCommit // 通知回调函数 triggerAfterCompletion(status, TransactionSynchronization.STATUS_ROLLED_BACK); throw ex; } catch (TransactionException ex) { // can only be caused by doCommit if (isRollbackOnCommitFailure()) { doRollbackOnCommitException(status, ex); } else { // 通知回调函数 triggerAfterCompletion(status, TransactionSynchronization.STATUS_UNKNOWN); } throw ex; } catch (RuntimeException ex) { if (!beforeCompletionInvoked) { // 通知回调函数 triggerBeforeCompletion(status); } doRollbackOnCommitException(status, ex); throw ex; } catch (Error err) { if (!beforeCompletionInvoked) { triggerBeforeCompletion(status); } doRollbackOnCommitException(status, err); throw err; }
// Trigger afterCommit callbacks, with an exception thrown there // propagated to callers but the transaction still considered as committed. try { triggerAfterCommit(status); } finally { triggerAfterCompletion(status, TransactionSynchronization.STATUS_COMMITTED); }
// org.springframework.transaction.support.AbstractPlatformTransactionManager#rollback /** * This implementation of rollback handles participating in existing * transactions. Delegates to {@code doRollback} and * {@code doSetRollbackOnly}. * @see #doRollback * @see #doSetRollbackOnly */ @Override publicfinalvoidrollback(TransactionStatus status)throws TransactionException { if (status.isCompleted()) { thrownew IllegalTransactionStateException( "Transaction is already completed - do not call commit or rollback more than once per transaction"); }
// Switch to manual commit if necessary. This is very expensive in some JDBC drivers, // so we don't want to do it unnecessarily (for example if we've explicitly // configured the connection pool to set it already). // 连接置为手动commit if (con.getAutoCommit()) { txObject.setMustRestoreAutoCommit(true); if (logger.isDebugEnabled()) { logger.debug("Switching JDBC Connection [" + con + "] to manual commit"); } con.setAutoCommit(false); } // 标记事务开始 txObject.getConnectionHolder().setTransactionActive(true);
// 事务超时时间 int timeout = determineTimeout(definition); if (timeout != TransactionDefinition.TIMEOUT_DEFAULT) { txObject.getConnectionHolder().setTimeoutInSeconds(timeout); }
// Bind the session holder to the thread. // 新创建的连接,需要交给spring管理(ThreadLocal) // DataSource --> ConnectionHolder if (txObject.isNewConnectionHolder()) { TransactionSynchronizationManager.bindResource(getDataSource(), txObject.getConnectionHolder()); } }
catch (Throwable ex) { // 异常时释放连接 if (txObject.isNewConnectionHolder()) { DataSourceUtils.releaseConnection(con, this.dataSource); txObject.setConnectionHolder(null, false); } thrownew CannotCreateTransactionException("Could not open JDBC Connection for transaction", ex); } }
提交事务:
1 2 3 4 5 6 7 8 9 10 11 12 13 14 15
// org.springframework.jdbc.datasource.DataSourceTransactionManager#doCommit @Override protectedvoiddoCommit(DefaultTransactionStatus status){ DataSourceTransactionObject txObject = (DataSourceTransactionObject) status.getTransaction(); Connection con = txObject.getConnectionHolder().getConnection(); if (status.isDebug()) { logger.debug("Committing JDBC transaction on Connection [" + con + "]"); } try { con.commit(); } catch (SQLException ex) { thrownew TransactionSystemException("Could not commit JDBC transaction", ex); } }
回滚事务:
1 2 3 4 5 6 7 8 9 10 11 12 13 14
@Override protectedvoiddoRollback(DefaultTransactionStatus status){ DataSourceTransactionObject txObject = (DataSourceTransactionObject) status.getTransaction(); Connection con = txObject.getConnectionHolder().getConnection(); if (status.isDebug()) { logger.debug("Rolling back JDBC transaction on Connection [" + con + "]"); } try { con.rollback(); } catch (SQLException ex) { thrownew TransactionSystemException("Could not roll back JDBC transaction", ex); } }
// Remove the connection holder from the thread, if exposed. // 清理ThreadLocal里绑定的连接 if (txObject.isNewConnectionHolder()) { TransactionSynchronizationManager.unbindResource(this.dataSource); }
// Reset connection. // 把conn 恢复原样 Connection con = txObject.getConnectionHolder().getConnection(); try { if (txObject.isMustRestoreAutoCommit()) { con.setAutoCommit(true); } DataSourceUtils.resetConnectionAfterTransaction(con, txObject.getPreviousIsolationLevel()); } catch (Throwable ex) { logger.debug("Could not reset JDBC Connection after transaction", ex); }
if (txObject.isNewConnectionHolder()) { if (logger.isDebugEnabled()) { logger.debug("Releasing JDBC Connection [" + con + "] after transaction"); } // 减少Conn计数 DataSourceUtils.releaseConnection(con, this.dataSource); }
// org.springframework.transaction.support.TransactionSynchronizationManager#bindResource /** * Bind the given resource for the given key to the current thread. * @param key the key to bind the value to (usually the resource factory) * @param value the value to bind (usually the active resource object) * @throws IllegalStateException if there is already a value bound to the thread * @see ResourceTransactionManager#getResourceFactory() */ publicstaticvoidbindResource(Object key, Object value)throws IllegalStateException { Object actualKey = TransactionSynchronizationUtils.unwrapResourceIfNecessary(key); Assert.notNull(value, "Value must not be null"); Map<Object, Object> map = resources.get(); // set ThreadLocal Map if none found if (map == null) { map = new HashMap<Object, Object>(); resources.set(map); } Object oldValue = map.put(actualKey, value); // Transparently suppress a ResourceHolder that was marked as void... if (oldValue instanceof ResourceHolder && ((ResourceHolder) oldValue).isVoid()) { oldValue = null; } // 事务挂起的时候要清理绑定的资源,不然开启新事务时,同一个dataSource会抛异常 if (oldValue != null) { thrownew IllegalStateException("Already value [" + oldValue + "] for key [" + actualKey + "] bound to thread [" + Thread.currentThread().getName() + "]"); } if (logger.isTraceEnabled()) { logger.trace("Bound value [" + value + "] for key [" + actualKey + "] to thread [" + Thread.currentThread().getName() + "]"); } }
/** * Unbind a resource for the given key from the current thread. * @param key the key to unbind (usually the resource factory) * @return the previously bound value (usually the active resource object) * @throws IllegalStateException if there is no value bound to the thread * @see ResourceTransactionManager#getResourceFactory() */ publicstatic Object unbindResource(Object key)throws IllegalStateException { Object actualKey = TransactionSynchronizationUtils.unwrapResourceIfNecessary(key); Object value = doUnbindResource(actualKey); if (value == null) { thrownew IllegalStateException( "No value for key [" + actualKey + "] bound to thread [" + Thread.currentThread().getName() + "]"); } return value; }
/** * Increase the reference count by one because the holder has been requested * (i.e. someone requested the resource held by it). */ publicvoidrequested(){ this.referenceCount++; }
/** * Decrease the reference count by one because the holder has been released * (i.e. someone released the resource held by it). */ publicvoidreleased(){ this.referenceCount--; }
/** * Return whether there are still open references to this holder. */ publicbooleanisOpen(){ return (this.referenceCount > 0); }
// org.springframework.jdbc.datasource.DataSourceUtils#doGetConnection if (TransactionSynchronizationManager.isSynchronizationActive()) { logger.debug("Registering transaction synchronization for JDBC Connection"); // Use same Connection for further JDBC actions within the transaction. // Thread-bound object will get removed by synchronization at transaction completion. ConnectionHolder holderToUse = conHolder; if (holderToUse == null) { holderToUse = new ConnectionHolder(con); } else { holderToUse.setConnection(con); } // 计数加一 holderToUse.requested(); TransactionSynchronizationManager.registerSynchronization( new ConnectionSynchronization(holderToUse, dataSource)); holderToUse.setSynchronizedWithTransaction(true); if (holderToUse != conHolder) { TransactionSynchronizationManager.bindResource(dataSource, holderToUse); } }
@Resource private MinderDao minderDao; public MindEntity query(){ final MindEntity mindEntity = minderDao.selectOne(1); return mindEntity; }
源码分析
SqlSessionFactoryBean
FactoryBean that creates an MyBatis SqlSessionFactory. This is the usual way to set up a shared MyBatis {@code SqlSessionFactory} in a Spring > >application context; the SqlSessionFactory can then be passed to MyBatis-based DAOs via dependency injection.
BeanDefinitionRegistryPostProcessor that searches recursively starting from a base package for interfaces and registers them as MapperFactoryBean . Note that only interfaces with at least one method will be registered; concrete classes will be ignored.
if (logger.isDebugEnabled()) { logger.debug("Creating MapperFactoryBean with name '" + holder.getBeanName() + "' and '" + definition.getBeanClassName() + "' mapperInterface"); }
// the mapper interface is the original class of the bean // but, the actual class of the bean is MapperFactoryBean // 注册的是MapperFactoryBean, 构造参数第一个字段是接口类型 definition.getConstructorArgumentValues().addGenericArgumentValue(definition.getBeanClassName()); // issue #59 definition.setBeanClass(this.mapperFactoryBean.getClass());
// 添加sqlSessionTemplate属性 if (StringUtils.hasText(this.sqlSessionTemplateBeanName)) { if (explicitFactoryUsed) { logger.warn("Cannot use both: sqlSessionTemplate and sqlSessionFactory together. sqlSessionFactory is ignored."); } definition.getPropertyValues().add("sqlSessionTemplate", new RuntimeBeanReference(this.sqlSessionTemplateBeanName)); explicitFactoryUsed = true; } elseif (this.sqlSessionTemplate != null) { if (explicitFactoryUsed) { logger.warn("Cannot use both: sqlSessionTemplate and sqlSessionFactory together. sqlSessionFactory is ignored."); } definition.getPropertyValues().add("sqlSessionTemplate", this.sqlSessionTemplate); explicitFactoryUsed = true; }
if (!explicitFactoryUsed) { if (logger.isDebugEnabled()) { logger.debug("Enabling autowire by type for MapperFactoryBean with name '" + holder.getBeanName() + "'."); } definition.setAutowireMode(AbstractBeanDefinition.AUTOWIRE_BY_TYPE); } } }
privatefinal PersistenceExceptionTranslator exceptionTranslator; /** * Constructs a Spring managed {@code SqlSession} with the given * {@code SqlSessionFactory} and {@code ExecutorType}. * A custom {@code SQLExceptionTranslator} can be provided as an * argument so any {@code PersistenceException} thrown by MyBatis * can be custom translated to a {@code RuntimeException} * The {@code SQLExceptionTranslator} can also be null and thus no * exception translation will be done and MyBatis exceptions will be * thrown * * @param sqlSessionFactory * @param executorType * @param exceptionTranslator */ publicSqlSessionTemplate(SqlSessionFactory sqlSessionFactory, ExecutorType executorType, PersistenceExceptionTranslator exceptionTranslator){
notNull(sqlSessionFactory, "Property 'sqlSessionFactory' is required"); notNull(executorType, "Property 'executorType' is required");
this.sqlSessionFactory = sqlSessionFactory; this.executorType = executorType; this.exceptionTranslator = exceptionTranslator; // 这里生成了JDK的代理类,实际调用请求被转发给了SqlSessionInterceptor this.sqlSessionProxy = (SqlSession) newProxyInstance( SqlSessionFactory.class.getClassLoader(), new Class[] { SqlSession.class }, new SqlSessionInterceptor()); } /** * {@inheritDoc} */ @Override public <T> T selectOne(String statement){ // 接口的相关方法都转发给代理类 returnthis.sqlSessionProxy.<T> selectOne(statement); } }
// org.mybatis.spring.SqlSessionTemplate.SqlSessionInterceptor /** * Proxy needed to route MyBatis method calls to the proper SqlSession got * from Spring's Transaction Manager * It also unwraps exceptions thrown by {@code Method#invoke(Object, Object...)} to * pass a {@code PersistenceException} to the {@code PersistenceExceptionTranslator}. */ privateclassSqlSessionInterceptorimplementsInvocationHandler{ @Override public Object invoke(Object proxy, Method method, Object[] args)throws Throwable { // 这一步是关键,获取sqlSession SqlSession sqlSession = getSqlSession( SqlSessionTemplate.this.sqlSessionFactory, SqlSessionTemplate.this.executorType, SqlSessionTemplate.this.exceptionTranslator); try { // 反射调用delegate对应的方法 Object result = method.invoke(sqlSession, args); if (!isSqlSessionTransactional(sqlSession, SqlSessionTemplate.this.sqlSessionFactory)) { // force commit even on non-dirty sessions because some databases require // a commit/rollback before calling close() // 非spring管理的,强制commit sqlSession.commit(true); } return result; } catch (Throwable t) { Throwable unwrapped = unwrapThrowable(t); if (SqlSessionTemplate.this.exceptionTranslator != null && unwrapped instanceof PersistenceException) { // release the connection to avoid a deadlock if the translator is no loaded. See issue #22 // 异常时要确保sqlSession被关闭 closeSqlSession(sqlSession, SqlSessionTemplate.this.sqlSessionFactory); sqlSession = null; // 翻译成spring定义的标准异常 Throwable translated = SqlSessionTemplate.this.exceptionTranslator.translateExceptionIfPossible((PersistenceException) unwrapped); if (translated != null) { unwrapped = translated; } } throw unwrapped; } finally { if (sqlSession != null) { closeSqlSession(sqlSession, SqlSessionTemplate.this.sqlSessionFactory); } } } }
// org.mybatis.spring.SqlSessionUtils#closeSqlSession /** * Checks if {@code SqlSession} passed as an argument is managed by Spring {@code TransactionSynchronizationManager} * If it is not, it closes it, otherwise it just updates the reference counter and * lets Spring call the close callback when the managed transaction ends * * @param session * @param sessionFactory */ publicstaticvoidcloseSqlSession(SqlSession session, SqlSessionFactory sessionFactory){ notNull(session, NO_SQL_SESSION_SPECIFIED); notNull(sessionFactory, NO_SQL_SESSION_FACTORY_SPECIFIED);
/** * Callback for cleaning up resources. It cleans TransactionSynchronizationManager and * also commits and closes the {@code SqlSession}. * It assumes that {@code Connection} life cycle will be managed by * {@code DataSourceTransactionManager} or {@code JtaTransactionManager} */ privatestaticfinalclassSqlSessionSynchronizationextendsTransactionSynchronizationAdapter{ /** * {@inheritDoc} */ @Override publicvoidsuspend(){ if (this.holderActive) { if (LOGGER.isDebugEnabled()) { LOGGER.debug("Transaction synchronization suspending SqlSession [" + this.holder.getSqlSession() + "]"); } // 清空ThreadLocal,为新事务做准备 TransactionSynchronizationManager.unbindResource(this.sessionFactory); } }
/** * {@inheritDoc} */ @Override publicvoidbeforeCommit(boolean readOnly){ // Connection commit or rollback will be handled by ConnectionSynchronization or // DataSourceTransactionManager. // But, do cleanup the SqlSession / Executor, including flushing BATCH statements so // they are actually executed. // SpringManagedTransaction will no-op the commit over the jdbc connection // TODO This updates 2nd level caches but the tx may be rolledback later on! if (TransactionSynchronizationManager.isActualTransactionActive()) { try { if (LOGGER.isDebugEnabled()) { LOGGER.debug("Transaction synchronization committing SqlSession [" + this.holder.getSqlSession() + "]"); } this.holder.getSqlSession().commit(); } catch (PersistenceException p) { if (this.holder.getPersistenceExceptionTranslator() != null) { DataAccessException translated = this.holder .getPersistenceExceptionTranslator() .translateExceptionIfPossible(p); if (translated != null) { throw translated; } } throw p; } } }
/** * {@inheritDoc} */ @Override publicvoidbeforeCompletion(){ // Issue #18 Close SqlSession and deregister it now // because afterCompletion may be called from a different thread if (!this.holder.isOpen()) { if (LOGGER.isDebugEnabled()) { LOGGER.debug("Transaction synchronization deregistering SqlSession [" + this.holder.getSqlSession() + "]"); } TransactionSynchronizationManager.unbindResource(sessionFactory); this.holderActive = false; if (LOGGER.isDebugEnabled()) { LOGGER.debug("Transaction synchronization closing SqlSession [" + this.holder.getSqlSession() + "]"); } this.holder.getSqlSession().close(); } }
/** * {@inheritDoc} */ @Override publicvoidafterCompletion(int status){ if (this.holderActive) { // afterCompletion may have been called from a different thread // so avoid failing if there is nothing in this one if (LOGGER.isDebugEnabled()) { LOGGER.debug("Transaction synchronization deregistering SqlSession [" + this.holder.getSqlSession() + "]"); } TransactionSynchronizationManager.unbindResourceIfPossible(sessionFactory); this.holderActive = false; if (LOGGER.isDebugEnabled()) { LOGGER.debug("Transaction synchronization closing SqlSession [" + this.holder.getSqlSession() + "]"); } this.holder.getSqlSession().close(); } this.holder.reset(); } } }
SpringManagedTransaction
SpringManagedTransaction handles the lifecycle of a JDBC connection. It retrieves a connection from Spring’s transaction manager and returns it back to it when it is no longer needed. If Spring’s transaction handling is active it will no-op all commit/rollback/close calls assuming that the Spring transaction manager will do the job. If it is not it will behave like JdbcTransaction.
publicclassSpringManagedTransactionimplementsTransaction{ /** * {@inheritDoc} */ @Override public Connection getConnection()throws SQLException { if (this.connection == null) { openConnection(); } returnthis.connection; } /** * Gets a connection from Spring transaction manager and discovers if this * {@code Transaction} should manage connection or let it to Spring. * <p> * It also reads autocommit setting because when using Spring Transaction MyBatis * thinks that autocommit is always false and will always call commit/rollback * so we need to no-op that calls. */ privatevoidopenConnection()throws SQLException { // 委托给了spring的工具类来获取连接 this.connection = DataSourceUtils.getConnection(this.dataSource); this.autoCommit = this.connection.getAutoCommit(); this.isConnectionTransactional = DataSourceUtils.isConnectionTransactional(this.connection, this.dataSource);
/** * Actually obtain a JDBC Connection from the given DataSource. * Same as {@link #getConnection}, but throwing the original SQLException. * <p>Is aware of a corresponding Connection bound to the current thread, for example * when using {@link DataSourceTransactionManager}. Will bind a Connection to the thread * if transaction synchronization is active (e.g. if in a JTA transaction). * <p>Directly accessed by {@link TransactionAwareDataSourceProxy}. * @param dataSource the DataSource to obtain Connections from * @return a JDBC Connection from the given DataSource * @throws SQLException if thrown by JDBC methods * @see #doReleaseConnection */ publicstatic Connection doGetConnection(DataSource dataSource)throws SQLException { Assert.notNull(dataSource, "No DataSource specified");
// 从ThreadLocal中去获取ConnectionHolder ConnectionHolder conHolder = (ConnectionHolder) TransactionSynchronizationManager.getResource(dataSource); if (conHolder != null && (conHolder.hasConnection() || conHolder.isSynchronizedWithTransaction())) { // 引用计数+1 conHolder.requested(); if (!conHolder.hasConnection()) { logger.debug("Fetching resumed JDBC Connection from DataSource"); conHolder.setConnection(dataSource.getConnection()); } return conHolder.getConnection(); } // Else we either got no holder or an empty thread-bound holder here. // 获取连接 logger.debug("Fetching JDBC Connection from DataSource"); Connection con = dataSource.getConnection(); // 事务的场景下,才会复用连接 if (TransactionSynchronizationManager.isSynchronizationActive()) { // 第一次进来的时候ThreadLocal里是没有ConnectionHolder的,这里需要获取连接,然后注册给spring管理 logger.debug("Registering transaction synchronization for JDBC Connection"); // Use same Connection for further JDBC actions within the transaction. // Thread-bound object will get removed by synchronization at transaction completion. ConnectionHolder holderToUse = conHolder; if (holderToUse == null) { holderToUse = new ConnectionHolder(con); } else { holderToUse.setConnection(con); } // 引用计数+1 // referenceCount++ holderToUse.requested(); // 注册回调处理函数,事务状态发生变化时,会处理connHolder TransactionSynchronizationManager.registerSynchronization( new ConnectionSynchronization(holderToUse, dataSource)); holderToUse.setSynchronizedWithTransaction(true); if (holderToUse != conHolder) { // 绑定到ThreadLocal TransactionSynchronizationManager.bindResource(dataSource, holderToUse); } }
return con; }
// org.springframework.jdbc.datasource.DataSourceUtils#releaseConnection /** * Close the given Connection, obtained from the given DataSource, * if it is not managed externally (that is, not bound to the thread). * @param con the Connection to close if necessary * (if this is {@code null}, the call will be ignored) * @param dataSource the DataSource that the Connection was obtained from * (may be {@code null}) * @see #getConnection */ publicstaticvoidreleaseConnection(Connection con, DataSource dataSource){ try { doReleaseConnection(con, dataSource); } catch (SQLException ex) { logger.debug("Could not close JDBC Connection", ex); } catch (Throwable ex) { logger.debug("Unexpected exception on closing JDBC Connection", ex); } }
publicstaticvoiddoReleaseConnection(Connection con, DataSource dataSource)throws SQLException { if (con == null) { return; } if (dataSource != null) { ConnectionHolder conHolder = (ConnectionHolder) TransactionSynchronizationManager.getResource(dataSource); if (conHolder != null && connectionEquals(conHolder, con)) { // It's the transactional Connection: Don't close it. // 事务连接,这里只是减少计数,实际的释放在事务完成之后,在ConnectionSynchronization中处理的 // referenceCount-- conHolder.released(); return; } } logger.debug("Returning JDBC Connection to DataSource"); // 非事务连接,直接关闭 doCloseConnection(con, dataSource); }
// org.springframework.jdbc.datasource.DataSourceUtils.ConnectionSynchronization /** * Callback for resource cleanup at the end of a non-native JDBC transaction * (e.g. when participating in a JtaTransactionManager transaction). * @see org.springframework.transaction.jta.JtaTransactionManager */ privatestaticclassConnectionSynchronizationextendsTransactionSynchronizationAdapter{
@Override publicvoidsuspend(){ // 比如事务的传播行为是REQUEST_NEW,每次都会创建一个新连接, // 会挂起当前的事务,当事务挂起的时候,就会回调到这里 // conn在ThreadLocal中的缓存形式是 dataSource -> conn // 所以这里要先把之前的conn给unbind掉,新的连接才能正常的工作 if (this.holderActive) { // dataSource -> conn 清除上一个事务对应的连接 TransactionSynchronizationManager.unbindResource(this.dataSource); // isOpen就是看引用技术是否大于0,如果大于0标识还有人在用,这里不会关闭 if (this.connectionHolder.hasConnection() && !this.connectionHolder.isOpen()) { // Release Connection on suspend if the application doesn't keep // a handle to it anymore. We will fetch a fresh Connection if the // application accesses the ConnectionHolder again after resume, // assuming that it will participate in the same transaction. releaseConnection(this.connectionHolder.getConnection(), this.dataSource); this.connectionHolder.setConnection(null); } } }
@Override publicvoidbeforeCompletion(){ // Release Connection early if the holder is not open anymore // (that is, not used by another resource like a Hibernate Session // that has its own cleanup via transaction synchronization), // to avoid issues with strict JTA implementations that expect // the close call before transaction completion. // 事务完成之前 // 这个阶段如果conn已经没有引用了,就直接关闭 if (!this.connectionHolder.isOpen()) { TransactionSynchronizationManager.unbindResource(this.dataSource); this.holderActive = false; if (this.connectionHolder.hasConnection()) { releaseConnection(this.connectionHolder.getConnection(), this.dataSource); } } }
@Override publicvoidafterCompletion(int status){ // If we haven't closed the Connection in beforeCompletion, // close it now. The holder might have been used for other // cleanup in the meantime, for example by a Hibernate Session. if (this.holderActive) { // The thread-bound ConnectionHolder might not be available anymore, // since afterCompletion might get called from a different thread. TransactionSynchronizationManager.unbindResourceIfPossible(this.dataSource); // 置为非活跃 this.holderActive = false; if (this.connectionHolder.hasConnection()) { releaseConnection(this.connectionHolder.getConnection(), this.dataSource); // Reset the ConnectionHolder: It might remain bound to the thread. this.connectionHolder.setConnection(null); } } // 清空当前holder的状态 this.connectionHolder.reset(); } }
final List<Object> selectAll = sqlSession.selectList("selectAll", null, new RowBounds(10, 20));
但是这种方式缺乏类型安全,参数传递的过程容易出错。
使用代理类
mybatis还支持生成代理类的方式来使用:
1 2 3 4 5
<mappernamespace="com.air.mybatis.sqlsession.WordsDao"> <selectid="selectAll"fetchSize="3"resultSetType="SCROLL_INSENSITIVE"resultType="com.air.mybatis.sqlsession.WordEntity"> select * from words </select> </mapper>
public Class<T> getMapperInterface(){ return mapperInterface; }
public Map<Method, MapperMethodInvoker> getMethodCache(){ return methodCache; }
// 创建JDK代理对象,实际的调用委托给mapperProxy @SuppressWarnings("unchecked") protected T newInstance(MapperProxy<T> mapperProxy){ return (T) Proxy.newProxyInstance(mapperInterface.getClassLoader(), new Class[] { mapperInterface }, mapperProxy); }
// 这里是入口 public T newInstance(SqlSession sqlSession){ final MapperProxy<T> mapperProxy = new MapperProxy<>(sqlSession, mapperInterface, methodCache); // 创建JDK代理对象,实际的调用委托给mapperProxy return newInstance(mapperProxy); } }
// org.apache.ibatis.builder.xml.XMLMapperBuilder#bindMapperForNamespace privatevoidbindMapperForNamespace(){ String namespace = builderAssistant.getCurrentNamespace(); if (namespace != null) { Class<?> boundType = null; try { boundType = Resources.classForName(namespace); } catch (ClassNotFoundException e) { //ignore, bound type is not required } // 如果namespace是一个类,比如WordsDao,就加到Mapper的Registry中 if (boundType != null) { if (!configuration.hasMapper(boundType)) { // Spring may not know the real resource name so we set a flag // to prevent loading again this resource from the mapper interface // look at MapperAnnotationBuilder#loadXmlResource configuration.addLoadedResource("namespace:" + namespace); configuration.addMapper(boundType); } } } }
// org.apache.ibatis.binding.MapperRegistry#addMapper public <T> voidaddMapper(Class<T> type){ if (type.isInterface()) { if (hasMapper(type)) { thrownew BindingException("Type " + type + " is already known to the MapperRegistry."); } boolean loadCompleted = false; try { knownMappers.put(type, new MapperProxyFactory<>(type)); // It's important that the type is added before the parser is run // otherwise the binding may automatically be attempted by the // mapper parser. If the type is already known, it won't try. MapperAnnotationBuilder parser = new MapperAnnotationBuilder(config, type); parser.parse(); loadCompleted = true; } finally { if (!loadCompleted) { knownMappers.remove(type); } } } }